Probabilistic Roadmaps
!pip install ipymplRequirement already satisfied: ipympl in /home/vdhiman/.local/venvs/ece490/lib/python3.10/site-packages (0.9.7)
Requirement already satisfied: ipython<10 in /home/vdhiman/.local/venvs/ece490/lib/python3.10/site-packages (from ipympl) (8.37.0)
Requirement already satisfied: ipywidgets<9,>=7.6.0 in /home/vdhiman/.local/venvs/ece490/lib/python3.10/site-packages (from ipympl) (8.1.7)
Requirement already satisfied: matplotlib<4,>=3.5.0 in /home/vdhiman/.local/venvs/ece490/lib/python3.10/site-packages (from ipympl) (3.10.6)
Requirement already satisfied: numpy in /home/vdhiman/.local/venvs/ece490/lib/python3.10/site-packages (from ipympl) (2.2.6)
Requirement already satisfied: pillow in /home/vdhiman/.local/venvs/ece490/lib/python3.10/site-packages (from ipympl) (11.3.0)
Requirement already satisfied: traitlets<6 in /home/vdhiman/.local/venvs/ece490/lib/python3.10/site-packages (from ipympl) (5.14.3)
Requirement already satisfied: decorator in /home/vdhiman/.local/venvs/ece490/lib/python3.10/site-packages (from ipython<10->ipympl) (5.2.1)
Requirement already satisfied: exceptiongroup in /home/vdhiman/.local/venvs/ece490/lib/python3.10/site-packages (from ipython<10->ipympl) (1.3.0)
Requirement already satisfied: jedi>=0.16 in /home/vdhiman/.local/venvs/ece490/lib/python3.10/site-packages (from ipython<10->ipympl) (0.19.2)
Requirement already satisfied: matplotlib-inline in /home/vdhiman/.local/venvs/ece490/lib/python3.10/site-packages (from ipython<10->ipympl) (0.1.7)
Requirement already satisfied: pexpect>4.3 in /home/vdhiman/.local/venvs/ece490/lib/python3.10/site-packages (from ipython<10->ipympl) (4.9.0)
Requirement already satisfied: prompt_toolkit<3.1.0,>=3.0.41 in /home/vdhiman/.local/venvs/ece490/lib/python3.10/site-packages (from ipython<10->ipympl) (3.0.52)
Requirement already satisfied: pygments>=2.4.0 in /home/vdhiman/.local/venvs/ece490/lib/python3.10/site-packages (from ipython<10->ipympl) (2.19.2)
Requirement already satisfied: stack_data in /home/vdhiman/.local/venvs/ece490/lib/python3.10/site-packages (from ipython<10->ipympl) (0.6.3)
Requirement already satisfied: typing_extensions>=4.6 in /home/vdhiman/.local/venvs/ece490/lib/python3.10/site-packages (from ipython<10->ipympl) (4.15.0)
Requirement already satisfied: comm>=0.1.3 in /home/vdhiman/.local/venvs/ece490/lib/python3.10/site-packages (from ipywidgets<9,>=7.6.0->ipympl) (0.2.3)
Requirement already satisfied: widgetsnbextension~=4.0.14 in /home/vdhiman/.local/venvs/ece490/lib/python3.10/site-packages (from ipywidgets<9,>=7.6.0->ipympl) (4.0.14)
Requirement already satisfied: jupyterlab_widgets~=3.0.15 in /home/vdhiman/.local/venvs/ece490/lib/python3.10/site-packages (from ipywidgets<9,>=7.6.0->ipympl) (3.0.15)
Requirement already satisfied: contourpy>=1.0.1 in /home/vdhiman/.local/venvs/ece490/lib/python3.10/site-packages (from matplotlib<4,>=3.5.0->ipympl) (1.3.2)
Requirement already satisfied: cycler>=0.10 in /home/vdhiman/.local/venvs/ece490/lib/python3.10/site-packages (from matplotlib<4,>=3.5.0->ipympl) (0.12.1)
Requirement already satisfied: fonttools>=4.22.0 in /home/vdhiman/.local/venvs/ece490/lib/python3.10/site-packages (from matplotlib<4,>=3.5.0->ipympl) (4.59.2)
Requirement already satisfied: kiwisolver>=1.3.1 in /home/vdhiman/.local/venvs/ece490/lib/python3.10/site-packages (from matplotlib<4,>=3.5.0->ipympl) (1.4.9)
Requirement already satisfied: packaging>=20.0 in /home/vdhiman/.local/venvs/ece490/lib/python3.10/site-packages (from matplotlib<4,>=3.5.0->ipympl) (25.0)
Requirement already satisfied: pyparsing>=2.3.1 in /home/vdhiman/.local/venvs/ece490/lib/python3.10/site-packages (from matplotlib<4,>=3.5.0->ipympl) (3.2.3)
Requirement already satisfied: python-dateutil>=2.7 in /home/vdhiman/.local/venvs/ece490/lib/python3.10/site-packages (from matplotlib<4,>=3.5.0->ipympl) (2.9.0.post0)
Requirement already satisfied: wcwidth in /home/vdhiman/.local/venvs/ece490/lib/python3.10/site-packages (from prompt_toolkit<3.1.0,>=3.0.41->ipython<10->ipympl) (0.2.13)
Requirement already satisfied: parso<0.9.0,>=0.8.4 in /home/vdhiman/.local/venvs/ece490/lib/python3.10/site-packages (from jedi>=0.16->ipython<10->ipympl) (0.8.5)
Requirement already satisfied: ptyprocess>=0.5 in /home/vdhiman/.local/venvs/ece490/lib/python3.10/site-packages (from pexpect>4.3->ipython<10->ipympl) (0.7.0)
Requirement already satisfied: six>=1.5 in /home/vdhiman/.local/venvs/ece490/lib/python3.10/site-packages (from python-dateutil>=2.7->matplotlib<4,>=3.5.0->ipympl) (1.17.0)
Requirement already satisfied: executing>=1.2.0 in /home/vdhiman/.local/venvs/ece490/lib/python3.10/site-packages (from stack_data->ipython<10->ipympl) (2.2.1)
Requirement already satisfied: asttokens>=2.1.0 in /home/vdhiman/.local/venvs/ece490/lib/python3.10/site-packages (from stack_data->ipython<10->ipympl) (3.0.0)
Requirement already satisfied: pure-eval in /home/vdhiman/.local/venvs/ece490/lib/python3.10/site-packages (from stack_data->ipython<10->ipympl) (0.2.3)
import urllib
import os
def ensuredirs(path):
    os.makedirs(os.path.dirname(path), exist_ok=True)
    return path
wget = urllib.request.urlretrieve
url = 'https://vikasdhiman.info/ECE498-Mobile-Robots/notebooks/01-1901-discrete-planning/imgs/RRT-map.png'
filename = 'imgs/RRT-map.png'
wget(url, filename=ensuredirs(filename))
('imgs/RRT-map.png', <http.client.HTTPMessage at 0x7574a6d3e5f0>)%matplotlib inline
import numpy as np
import random
# random.seed(1004)
# np.random.seed(1004)
from PIL import Image
import matplotlib.pyplot as plt
# I removed the graph lines from the map above using photoshop and
# saved only the obstacles. Load that map as a png file.
# It is color image; convert it to grayscale.
img_gray = Image.open("imgs/RRT-map.png").convert('L')
# convert the image to a numpy array
img = np.asarray(img_gray)
fig, ax = plt.subplots()
ax.imshow(img, cmap='gray') # plot the image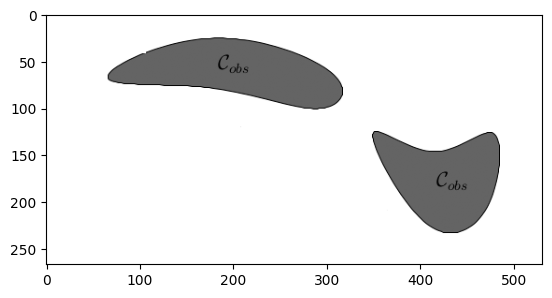
%matplotlib inline
# Pick some arbitray start and goal points
goal = (300., 25.)
start = (100., 200.)
fig, ax = plt.subplots()
ax.imshow(img, cmap='gray') # Plot the image again
ax.plot(start[0], start[1], 'r+', markersize=10, label='start')
ax.plot(goal[0], goal[1], 'g*', markersize=10, label='goal')
ax.legend()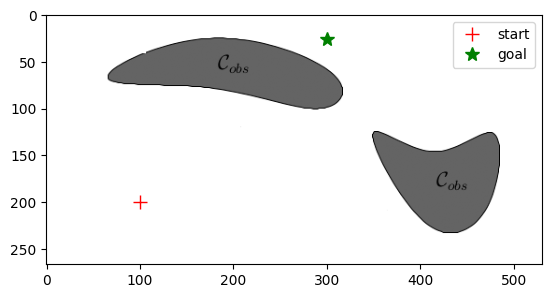
from dataclasses import dataclass
# Need img as the map representation
assert img is not None

@dataclass
class Vertex:
    """
    Class to encode a graph vertex with a unique idx : a number
    and its coordinates as a numpy array.
    """
    idx: int
    coord: np.ndarray

    # Make the PItem hashable
    # https://docs.python.org/3/glossary.html#term-hashable
    def __hash__(self):
        return self.idx

    def __eq__(self, other):
        return self.idx == other.idx

class Graph:
    """
    Keeps track of nodes and their 2D coordinates.
    The datastructure of choice here is an adjacency list.
    """
    def __init__(self):
        self.adjacency_list = {}
        self.vertex_list = []

    @classmethod
    def from_adjacency_matrix(cls, vertex_coords, G_adjacency_matrix):
        """
        Generate the graph from an adjacency matrix and vertex coordinates
        """
        self = cls()
        self.vertex_coordinates = vertex_coords
        for vi, v in enumerate(vertex_coords):
            vert = Vertex(idx=vi, coord=v)
            self.vertex_list.append(vert)
            self.adjacency_list[vert] = [
                Vertex(idx=pnj, coord=pn)
                for pnj, pn in enumerate(vertex_coords)
                if (G_adjacency_matrix[vi, pnj])]
        return self

    def get(self, v, default=[]):
        """
        Interface with path planning algorithms like astar using
        .get function.

        This function returns a list of neighbors along with
        edge-cost which is the euclidean distance between the
        coordinates of this ndoe and the neighbors.
        """
        vcoord = np.array(v.coord)
        return [(nbr, np.linalg.norm(vcoord-nbr.coord))
                for nbr in self.adjacency_list[v]]

    def add_vertex(self, coordinate):
        """
        Add new vertex to the graph. Assume it does not exists.
        """
        idx = len(self.vertex_list)
        vert = Vertex(idx=idx, coord=coordinate)
        self.adjacency_list[vert] = []
        self.vertex_list.append(vert)
        return vert

    def add_edge_directed(self, vi : Vertex, vj : Vertex):
        """
        Add a new edge to the graph from vi -> vj
        """
        assert isinstance(vi, Vertex)
        assert isinstance(vj, Vertex)
        self.adjacency_list.setdefault(vi, []).append(vj)

    def add_edge(self, vi, vj, undirected=True):
        """
        Add an undirected or directed edge to the graph.
        """
        self.add_edge_directed(vi, vj)
        if undirected:
            self.add_edge_directed(vj, vi)

    def remove_edge_directed(self, vi, vj):
        vjidx = self.adjacency_list[vi].index(vj)
        del self.adjacency_list[vi][vjidx]

    def remove_edge(self, vi, vj, undirected=True):
        self.remove_edge_directed(vi, vj)
        if undirected:
            self.remove_edge_directed(vj, vi)

    def vertices(self):
        """
        Return all vertices
        """
        return self.vertex_list

    def get_vertex(self, idx):
        """
        Get a perticular Vertex object by Vertex.idx
        """
        return self.vertex_list[idx]

    def vertex_coords(self):
        """
        Return the vertex coordinates as a numpy array
        """
        return np.asarray([vert.coord
                           for vert in self.vertex_list])

    def vertices_no_nbrs(self):
        """
        Return isolated vertices that do not have any
        neighbors.
        """
        return [vid for vid, nbrsid in self.adjacency_list.items()
                if not len(nbrsid)]

    def edges_coords(self):
        """
        Return edge_ids and edge_coords as lists where

        edge_ids = [(v1s.idx, v1e.idx),
                     (v2s.idx, v2e.idx), ...]
        edge_coords = [(v1s.coord, v2e.coord),
                        (v2s.coord, v2e.coord), ...]

        edge_ids contain the vertex indices as start and end pairs
        edge_coords contain the vertex coordinates for each edge with
        start and end pairs.
        """
        edge_ids = []
        edge_list = []
        for vid, nbrsid in self.adjacency_list.items():
            for nid in nbrsid:
                edge_ids.append((vid.idx, nid.idx))
                edge_list.append((vid.coord, nid.coord))
        return edge_ids, edge_list

    def plot(self, ax : plt.Axes, vertexids=False, marker='k*-'):
        """
        Plot the graph on the matplotlib axes object
        """
        ax.axis('equal')
        edge_ids, edge_coords = self.edges_coords()
        for (vid, nid), (v, n) in zip(edge_ids, edge_coords):
            ax.plot([v[0], n[0]], [v[1], n[1]], marker)
            if vertexids:
                ax.text(v[0], v[1], str(vid))
                ax.text(n[0], n[1], str(nid))

    def plot_path(self, ax : plt.Axes, path, color='r'):
        """
        Plat the path on the matplotlib axes
        """
        xs = []
        ys = []
        for vert in path:
            xs.append(vert.coord[0])
            ys.append(vert.coord[1])
        ax.plot(xs, ys, '-', color=color)

# 1. Initialize an empty graph with the start point
G_adjacency_list = Graph()
G_adjacency_list.add_vertex(start)

Npts = 1 # we are going to sample 100 points, but start with 1 point
pt_min, pt_max = np.array([0, 0]), np.array([img.shape[1], img.shape[0]])
# 2. While not done:
for i in range(Npts):
    # 2.a Sample points on the chosen area.
    # If the point is obstacle area, continue to the next iteration.
    random_pt = np.random.rand(2) * (pt_max - pt_min) + pt_min

random_pt
array([ 15.99364087, 132.38478183])%matplotlib inline
# Let's plot this point
def plot_map(ax, img, goal, start):
ax.imshow(img, cmap='gray') # Plot the image again
ax.plot(start[0], start[1], 'r+', markersize=10, label='start')
ax.plot(goal[0], goal[1], 'g*', markersize=10, label='goal')
ax.legend()
return ax
fig, ax = plt.subplots()
plot_map(ax, img, goal, start)
picked_pt, = ax.plot(random_pt[0], random_pt[1], 'bo', markersize=2, label='picked')
ax.legend()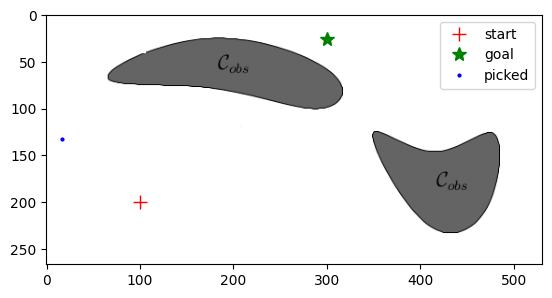
# check the color of image at the random_pt
# Note that I have used y-coordinate for rows and
# x-coordinate for cols
random_pt_int = np.round(random_pt).astype(dtype=np.int64)
img[random_pt_int[1], random_pt_int[0]]
np.uint8(255)
# 100 is darker than 255.
# Our collision check is checking for the color.
# I pick the threshold between 100 and 255 arbitrarily as
# 200
def do_points_collide(img, pts):
    """
    Returns true or false per point,

    If the point is out of the image on
    """
    # threshold between white (255) and gray (100) color
    threshold = 200 # chose the threshold as 200
    pts = np.round(pts).astype(dtype=np.int64) # convert the points to integers

    # Test if the points are inside the iamge or not
    # We are using numpy boolean operators
    # https://numpy.org/doc/stable/reference/generated/numpy.logical_and.html
    in_img = (
        (0 <= pts) # pts is a N x 2 => N x 2 array of booleans
        &
        (pts < np.array((img.shape[1], img.shape[0]))) # N x 2 array of booleans
    ).all(axis=-1) # True if and only if all the elements of the boolean array along axis is True
    out_of_img = ~in_img # Numpy not operator, N

    # Convert all the out of image points in image so that we can use them to index
    # in img
    in_img_pts = pts.copy() # N x 2
    # it does not matter what the value is as long as it is inside the img bounds
    in_img_pts[out_of_img, :] = 0  # Boolean indexing: only the parts of array where indexing array is true are selected

    # Index the image using pts. Y-coordinate is the row and X-coordinate is the column
    colors_per_pt = img[in_img_pts[..., 1], in_img_pts[..., 0]]
    # The points collide if they are out of the image or below the grayness threshold
    return (out_of_img) | (colors_per_pt < threshold)

def does_point_collide(img, pt):
    return do_points_collide(img, pt)

# Lets check our function again
# For a collision free point
assert does_point_collide(img, np.array([20.68332004, 228.68439464])) == False
# For a collision point
assert does_point_collide(img, np.array([200., 50.])) == True
def find_nearest_vertex(G_adjacency_list, pt):
"""
Find the nearest vertex to the point pt in the graph G_adjacency_list.
"""
vertices_np = G_adjacency_list.vertex_coords() # np.array of size N x 2
diff_vec = (vertices_np - pt) # np.array of size N x 2 # example of something called broadcasting
dists_per_vec = np.sqrt((diff_vec**2).sum(axis=-1)) # np.array of size N
closest_vertex = vertices_np[np.argmin(dists_per_vec)] # np.array of size 2
return closest_vertex Finding nearest point on edges
What if the nearest point lies on an edge rather than a vertex?
To compute this we need to find a formula for nearest point to a line. Consider a point and an edge where is the start vertex and is the end vertex for the edge. Find the shortest distance to the edge.
Representation of a line passsing through two points. Let be a free parameter. Then the line passinging through and is a set of all points
Moreover, if then the line point lies between the two end points and . If , then the point lies before and if then it lies after .
The shortest distance between a point and a line is along the perpendicular to the line that passes through . Let be such a point where the perpendicular from meets the line . Then we have,
This is one equation to solve for one variable ,
def closest_point_on_line_segs(edges, x):
    """
    Find the closest point to x on all the edges
    """
    assert edges.shape[-2] == 2
    *N, _, D = edges.shape
    vs, ve = edges[:, 0, :], edges[:, 1, :]
    # edge_vec = ve - vs # *N x D
    # edge_mag = np.linalg.norm(edge_vec, axis=-1, keepdims=True) #  *N
    # edge_unit = edge_vec / edge_mag # *N x D

    # closest pt on edge = l(t) = vs + t * (ve - vs)
    # t = (x - vs) @ (ve - vs) / ||ve - vs||^2
    edge_vec = (ve - vs)
    edge_vec_mag_sq = (edge_vec * edge_vec).sum(axis=-1, keepdims=True) # N x 1
    t = ((x - vs) * edge_vec).sum(axis=-1, keepdims=True) / edge_vec_mag_sq # N x 1

    # l(t) = vs + t * (ve - vs)
    lt = vs + t * edge_vec # *N x D

    # Perpendicular distance from the edge
    dist_e = np.linalg.norm(x - lt, axis=-1)

    # Distance from the end vertices
    dist_vs = np.linalg.norm(x - vs, axis=-1)
    dist_ve = np.linalg.norm(x - ve, axis=-1)
    # The minimum of the two is the closer one
    dist_v = np.minimum(dist_vs, dist_ve)

    # Is the point inside the edge?
    is_pt_inside_edge = ((0 <= t) & (t <= 1))[..., 0]


    # Take the edge distance only if the perpendicular falls
    # within the edge bounds otherwise take the minimumm
    # of the vertex distance
    dist = np.where(is_pt_inside_edge,
                    dist_e,
                    dist_v)
    min_idx = np.argmin(dist)
    closest_point, point_type =  (
        (lt[min_idx], slice(0, 2)) if is_pt_inside_edge[min_idx]
        else (vs[min_idx], slice(0, 1)) if (dist_vs[min_idx] < dist_ve[min_idx])
        else (ve[min_idx], slice(1, 2))
    )
    return closest_point, dist[min_idx], (min_idx, point_type)
def points_within_circle(edges, x, radius=None):
"""
Find all the edges that lie within a given radius of a point x
"""
assert edges.shape[-2] == 2
*N, _, D = edges.shape
vs, ve = edges[:, 0, :], edges[:, 1, :]
# edge_vec = ve - vs # *N x D
# edge_mag = np.linalg.norm(edge_vec, axis=-1, keepdims=True) # *N
# edge_unit = edge_vec / edge_mag # *N x D
# closest pt on edge = l(t) = vs + t * (ve - vs)
# t = (x - vs) @ (ve - vs) / ||ve - vs||^2
edge_vec = (ve - vs)
edge_vec_mag_sq = (edge_vec * edge_vec).sum(axis=-1, keepdims=True) # N x 1
t = ((x - vs) * edge_vec).sum(axis=-1, keepdims=True) / edge_vec_mag_sq # N x 1
# l(t) = vs + t * (ve - vs)
lt = vs + t * edge_vec # *N x D
# Perpendicular distance from the edge
dist_e = np.linalg.norm(x - lt, axis=-1)
# Distance from the end vertices
dist_vs = np.linalg.norm(x - vs, axis=-1)
dist_ve = np.linalg.norm(x - ve, axis=-1)
# The minimum of the two is the closer one
dist_v = np.minimum(dist_vs, dist_ve)
# Is the point inside the edge?
is_pt_inside_edge = ((0 <= t) & (t <= 1))[..., 0]
# Take the edge distance only if the perpendicular falls
# within the edge bounds otherwise take the minimumm
# of the vertex distance
dist = np.where(is_pt_inside_edge,
dist_e,
dist_v)
closest_points = np.where(is_pt_inside_edge,
lt,
np.where(dist_vs < dist_ve,
vs, ve))
point_type = np.where(is_pt_inside_edge,
slice(0, 2),
np.where(dist_vs < dist_ve,
slice(0, 1),
slice(1, 2)))
if radius is None:
radius = np.min(dist)
within_radius = dist < radius # a boolean per edge
dists_within_radius = dist[within_radius]
closest_points_within_radius = closest_points[within_radius]
indices_within_radius = np.arange(len(dist))[within_radius]
point_types_within_radius = point_type[within_radius]
return closest_points_within_radius, dists_within_radius, (indices_within_radius, point_types_within_radius)
def points_within_circle_on_graph(graph, pt, radius=None):
    vids = np.asarray([v.idx for v in graph.vertices()])
    verticesnp = np.asarray(graph.vertex_coords())
    dists_v = np.linalg.norm(verticesnp - pt, axis=-1)
    min_idx_v = np.argmin(dists_v)
    closest_point_v = verticesnp[min_idx_v]
    min_dist_v = dists_v[min_idx_v]
    if radius is None:
        radius = np.min(min_dist_v)
    else:
        radius = max(radius, np.min(min_dist_v))
    #print(f"using radius = {radius}")

    within_radius = dists_v <= radius # a boolean per edge
    dists_within_radius = dists_v[within_radius]
    closest_points_within_radius = verticesnp[within_radius]
    vids_within_radius = vids[within_radius]
    return closest_points_within_radius, dists_within_radius, [(graph.get_vertex(vid),) for vid in vids_within_radius]
def closest_point_on_graph(graph, pt):
assert len(graph.vertices())
edge_ids, edge_list = map(np.asarray, graph.edges_coords())
if len(edge_list):
closest_point_e, min_dist_e, min_idx_pt_type = closest_point_on_line_segs(edge_list, pt)
min_idx_e, pt_type = min_idx_pt_type
vids = edge_ids[min_idx_e, pt_type]
vertices = ((graph.get_vertex(vids[0]), graph.get_vertex(vids[1]))
if len(vids) == 2
else
(graph.get_vertex(vids[0]),))
else:
min_dist_e = np.inf
vertices_no_nbrs = graph.vertices_no_nbrs()
if len(vertices_no_nbrs):
verticesnp = np.array([vid.coord for vid in vertices_no_nbrs])
dists_v = np.linalg.norm(verticesnp - pt, axis=-1)
min_idx_v = np.argmin(dists_v)
closest_point_v = verticesnp[min_idx_v]
min_dist_v = dists_v[min_idx_v]
else:
min_dist_v = np.inf
return ((closest_point_v, min_dist_v, (vertices_no_nbrs[min_idx_v],))
if min_dist_v < min_dist_e
else (closest_point_e, min_dist_e, vertices))
def expand_graph(graph, pt, nearest_pt, nearest_pt_verts):
    if len(nearest_pt_verts) == 2: # Nearest point is on the edge
        vs, ve = nearest_pt_verts
        graph.remove_edge(vs, ve)
        npt_vert = graph.add_vertex(nearest_pt)
        #print(npt_vert.coord)
        graph.add_edge(vs, npt_vert)
        graph.add_edge(npt_vert, ve)
    elif len(nearest_pt_verts) == 1:
        npt_vert = nearest_pt_verts[0]
    else:
        raise ValueError("Invalid nearest_pt_vids")

    fid = graph.add_vertex(pt)
    #print(fid.coord)
    graph.add_edge(npt_vert, fid)
    return fid
# Create a random graph to stress test the function
def generate_random_graph(nvertices=10, # How many vertices
# Fraction of vertices connected to each other
# 1 means fully connected
# 0 means none connected
edge_density=0.2,
selfedges=False, # allow self edges
undirected=True, # is the graph undirected
pt_min=np.array([0., 0.]), # range of points
pt_max=np.array([1., 1.])):
"""
Generate a random graph with given
"""
D = pt_min.shape[0] # dimensions
vertices = np.random.rand(nvertices, D) * (pt_max - pt_min) + pt_min
G_adjacency_matrix_samples = np.random.rand(
nvertices, nvertices)
if undirected:
matrix_edge_density = edge_density / 2
G_adjacency_matrix_samples = np.tril(G_adjacency_matrix_samples, k=1)
G_adjacency_matrix_samples += G_adjacency_matrix_samples.T
G_adjacency_matrix_samples /= 2.
# Pick the edge if the uniformly sampled prob is below edge_density
G_adjacency_matrix = G_adjacency_matrix_samples < matrix_edge_density
if not selfedges:
np.fill_diagonal(G_adjacency_matrix, 0)
G_adjacency_list = Graph.from_adjacency_matrix(vertices.tolist(), G_adjacency_matrix)
return G_adjacency_list
generate_random_graph()<__main__.Graph at 0x75745e48e050>def does_edge_collide(graph, random_pt, nearest_pt, stepsize):
dist = np.linalg.norm(nearest_pt - random_pt)
steps = int(np.floor(dist / stepsize))
if steps <= 0:
return True, None
direction = (random_pt - nearest_pt) / np.linalg.norm(random_pt - nearest_pt)
all_points = np.arange(1, steps + 1)[:, None]*stepsize*direction+ nearest_pt[None, :]
collisions = do_points_collide(img, all_points)
if np.any(collisions):
return True, None
indices, = np.nonzero(collisions)
first_non_colliding = all_points[indices[0]-1] if len(indices) else random_pt
return False, first_non_colliding
%matplotlib inline
# Need img as the map representation
assert img is not None

#np.random.seed(41)
Npts = 1000 # we are going to sample 100 points, but start with 1 point
# Specify the bounds of the map
pt_min = np.array([0, 0])
pt_max = np.array([img.shape[1], img.shape[0]])

stepsize = 1
radius = 25

# 1. Initialize an empty graph with the start point
graph = Graph()
graph.add_vertex(start)

random_pt_is_goal = False
goal_paths = 0
# 2. While not done
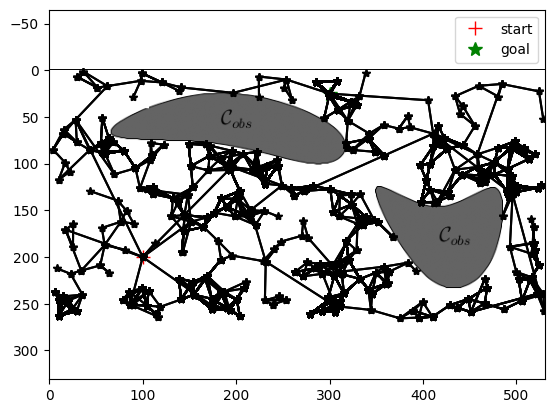
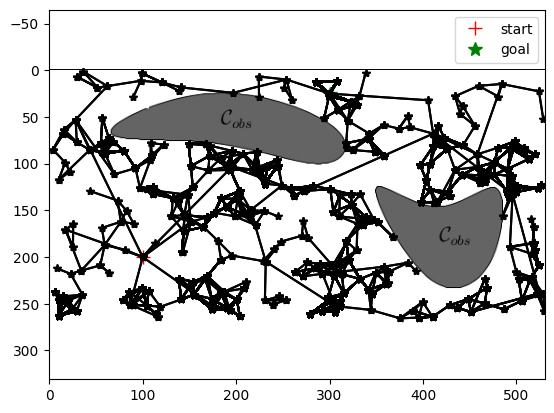
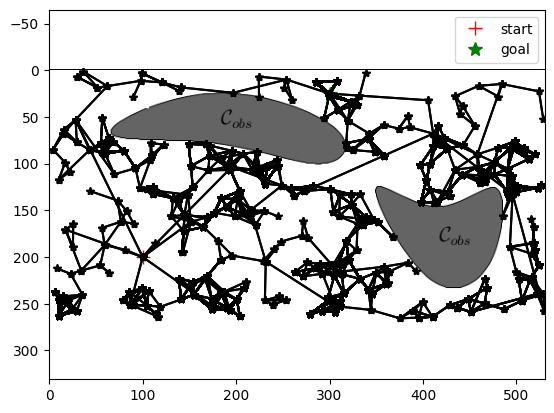
for i in range(Npts):
    # 2.a Sample points on the chosen area.
    if np.random.rand() > 0.95:
        random_pt = goal
        random_pt_is_goal = True
    else:
        random_pt = np.random.rand(2) * (pt_max - pt_min) + pt_min
        random_pt_is_goal = False

    nearest_pts, dists, nearest_pts_vids  = points_within_circle_on_graph(graph, random_pt, radius=radius)
    #print(f"Connecting to {len(nearest_pts_vids)} nearest pts at dists {dists}")
    for npt, dst, npt_vid in zip(nearest_pts, dists, nearest_pts_vids):
        # 2.B Connect the sampled point to the nearest point (vertex or edge)
        # on the graph, as long as the connecting line does not pass through the obstacle.
        collision, first_non_colliding = does_edge_collide(graph, random_pt, npt, stepsize)
        if collision:
            continue
        added_vert = expand_graph(graph, first_non_colliding, npt, npt_vid)

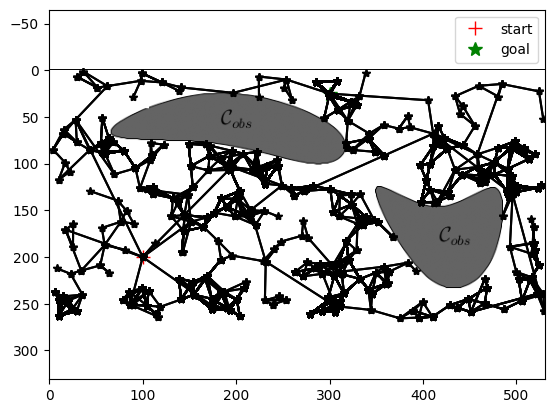
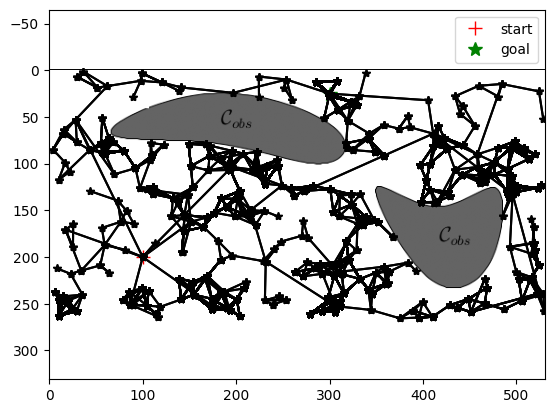
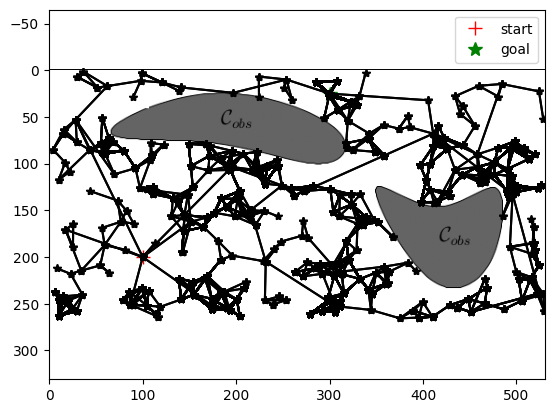
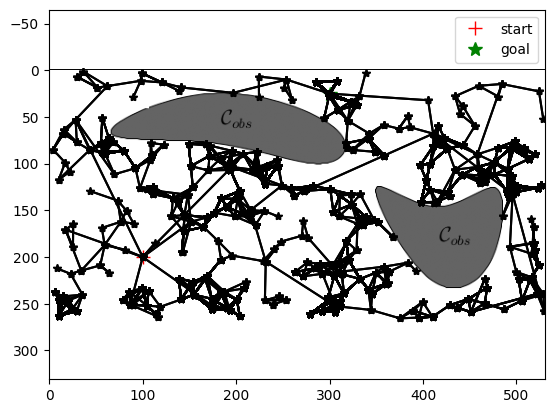
        if i % 50 == 0:
            fig, ax = plt.subplots()
            plot_map(ax, img, goal, start)
            graph.plot(ax)
            plt.show()

        if random_pt_is_goal and not collision:
            goal_vert = added_vert
            goal_paths += 1
    # if goal_paths >= 2:
    #     break

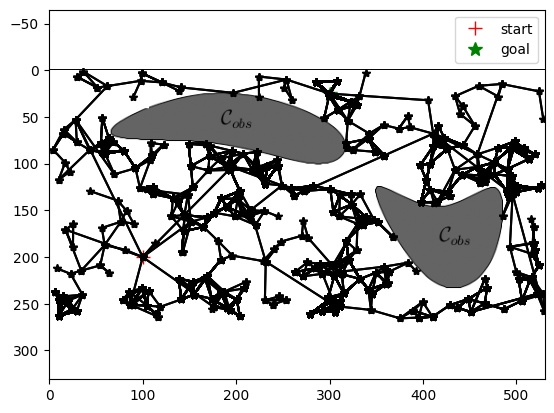
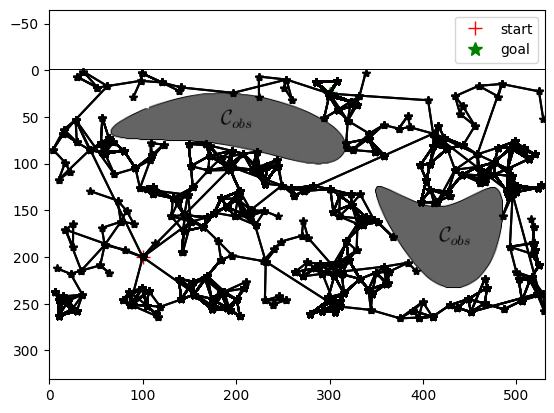
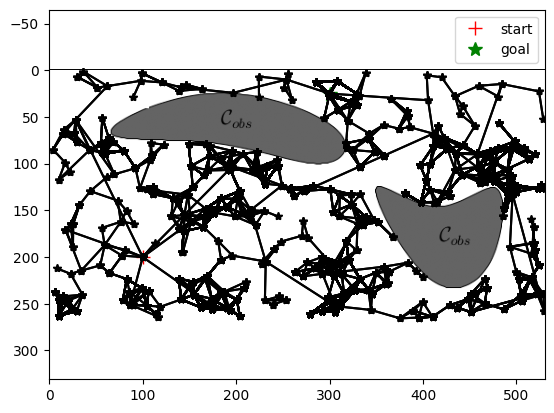
fig, ax = plt.subplots()
plot_map(ax, img, goal, start)
graph.plot(ax)
plt.show()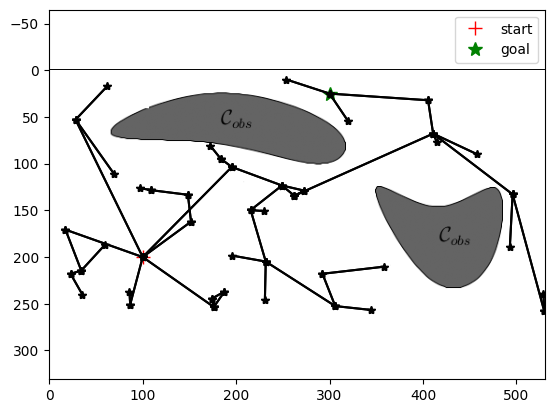
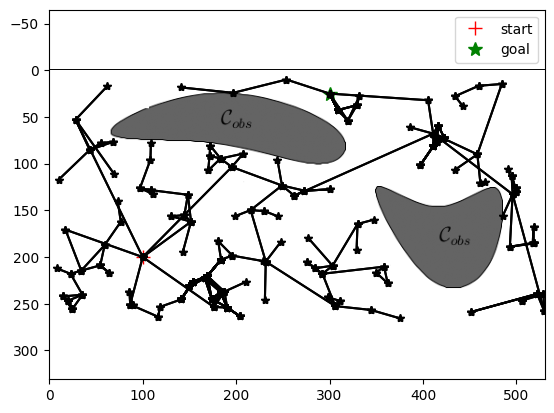
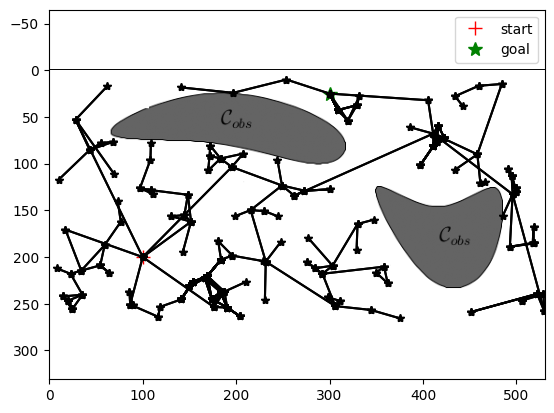
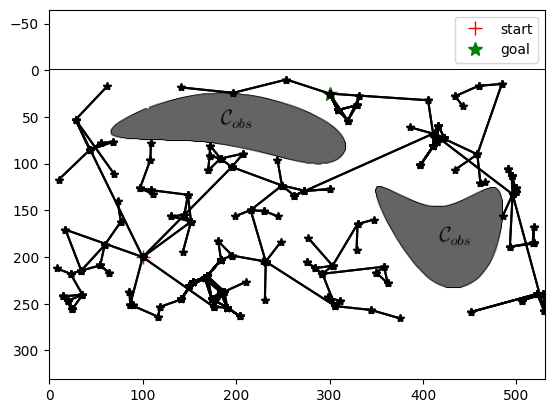
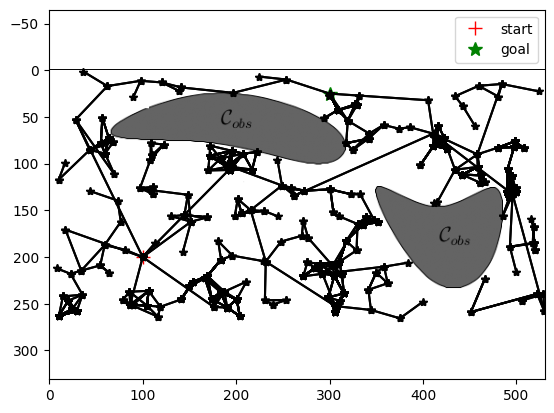
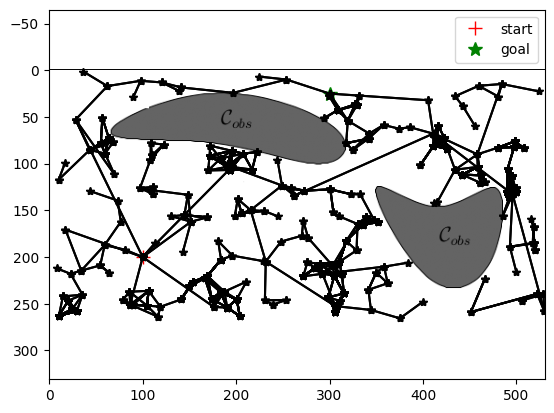
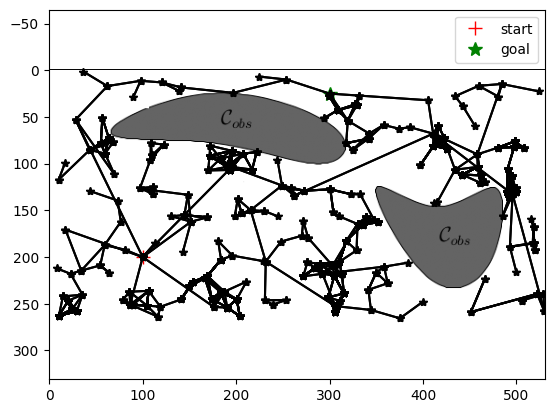
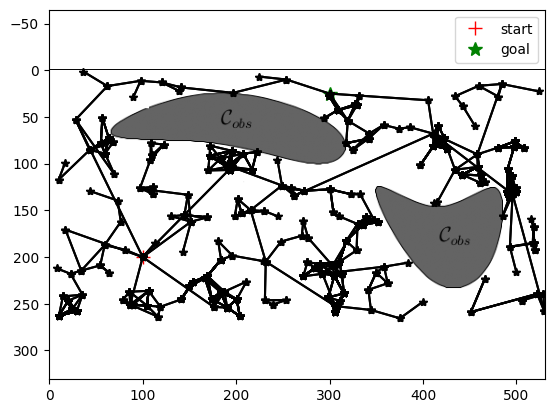
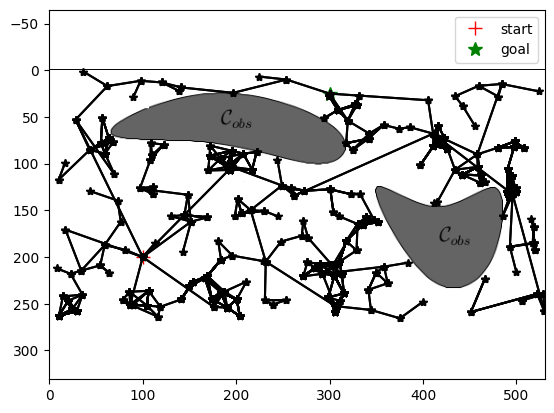
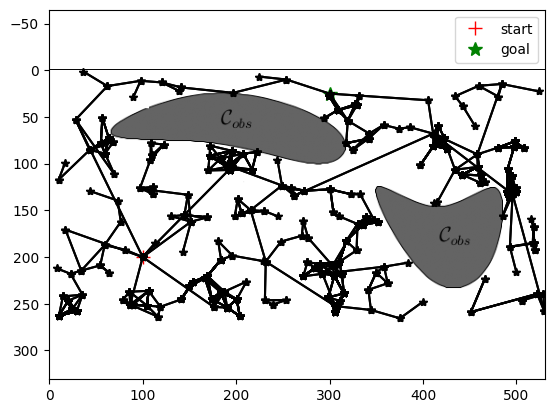
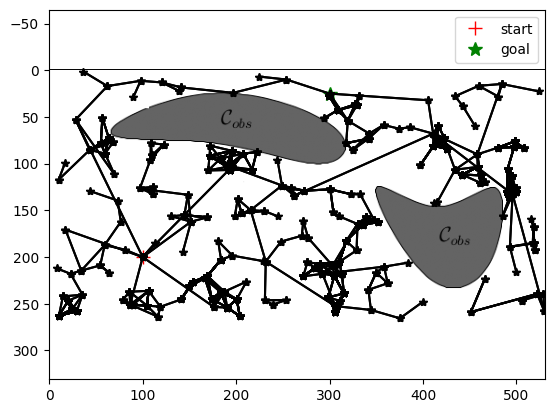
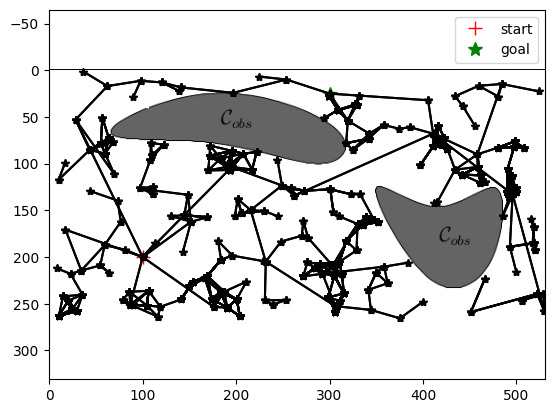
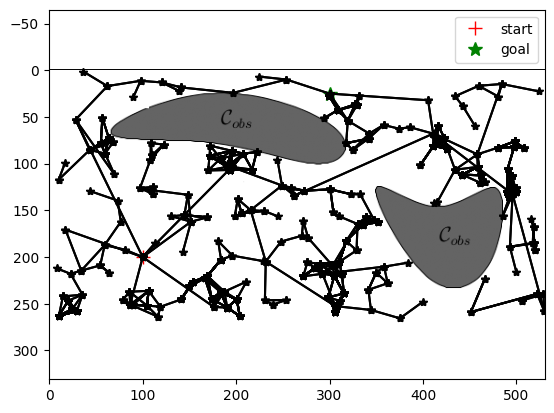
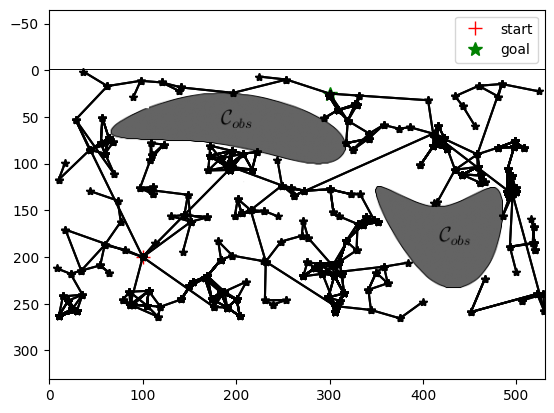
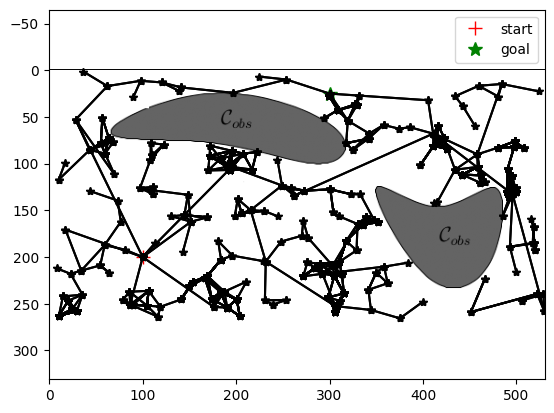
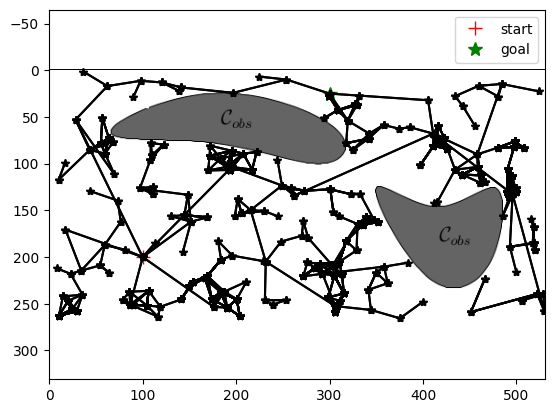
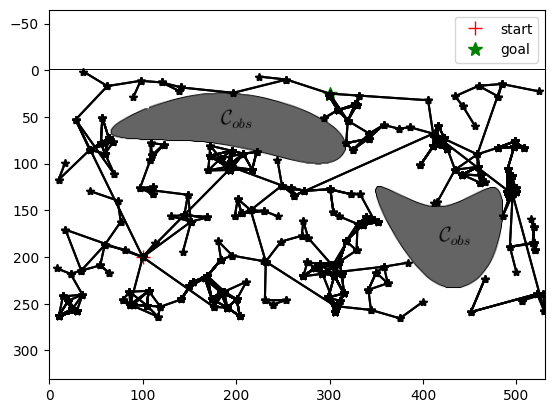
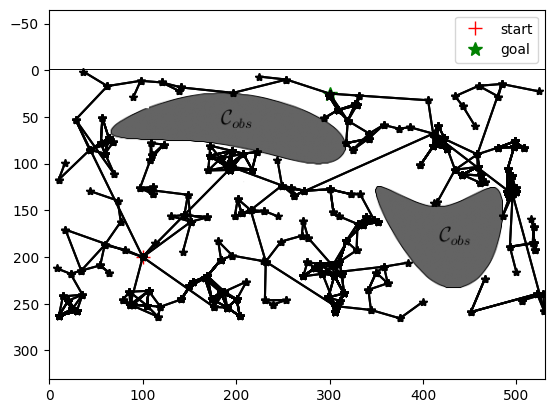
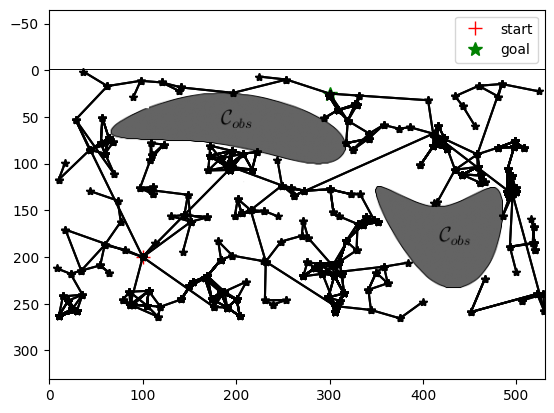
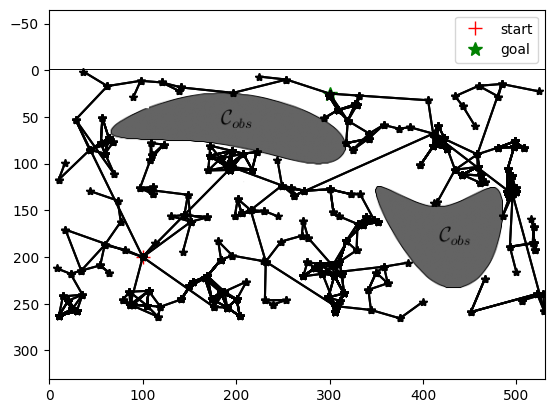
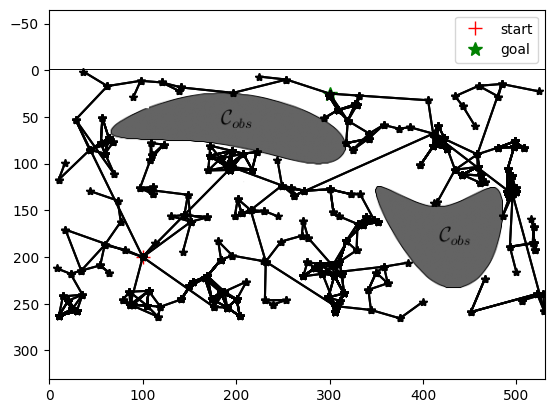
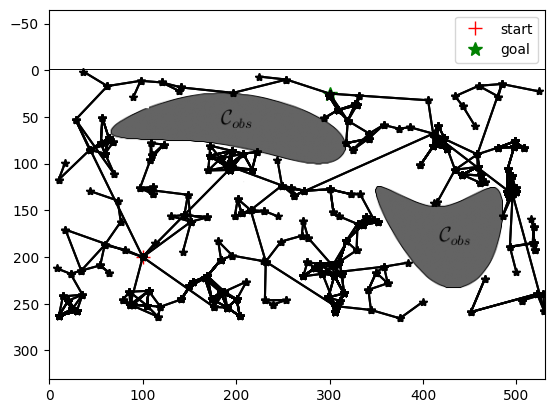
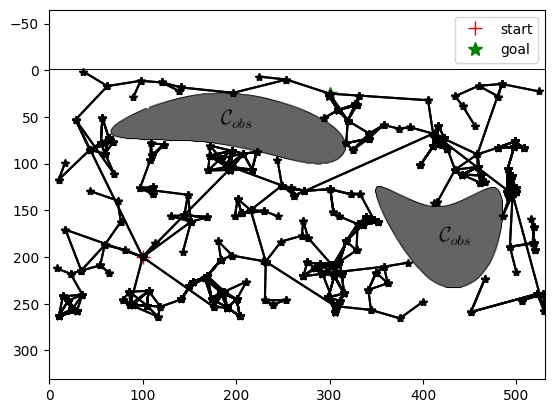
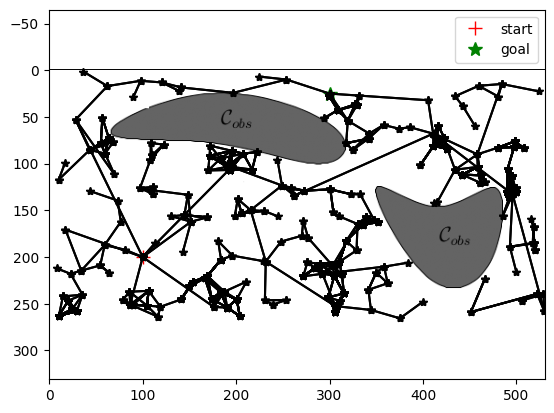
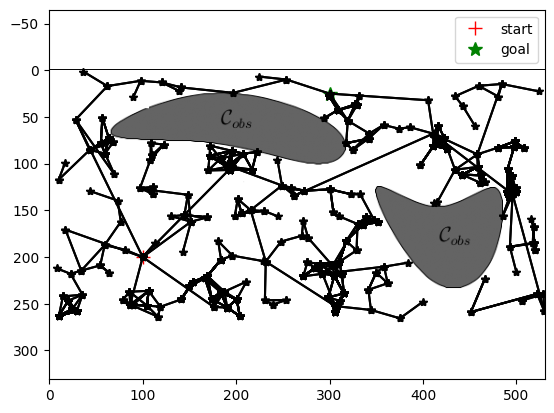
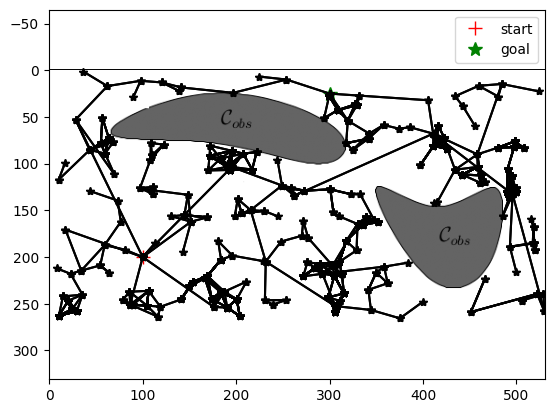
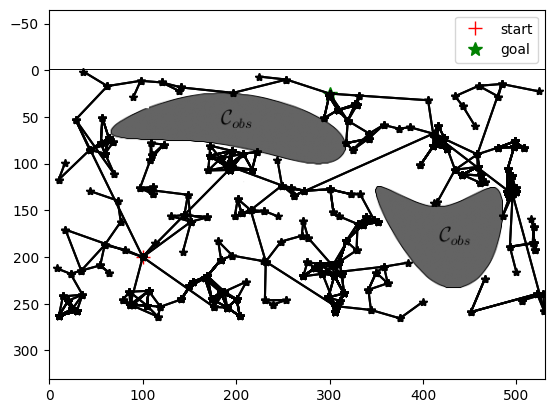
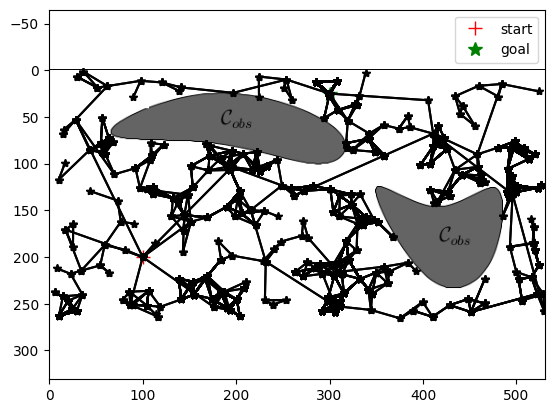
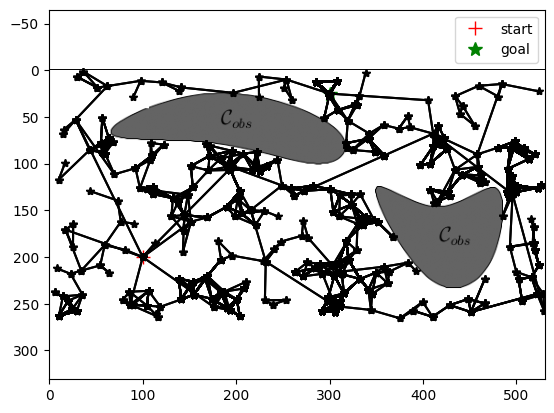
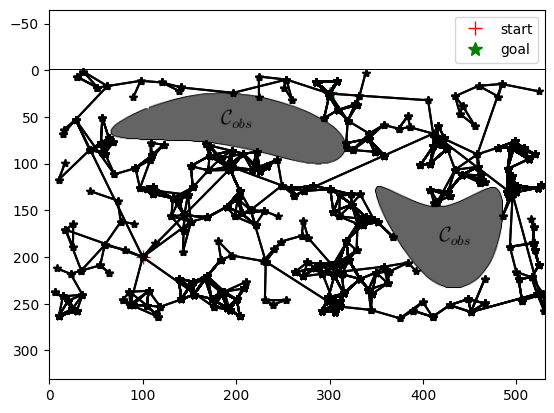
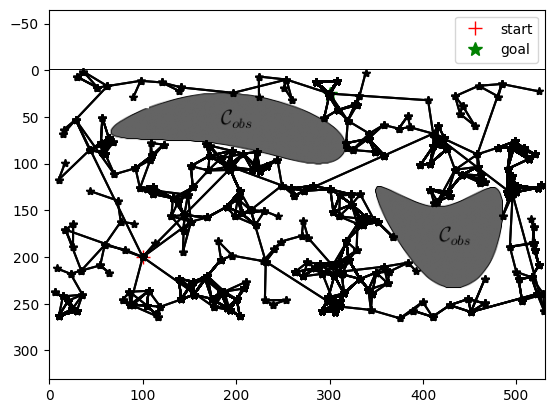
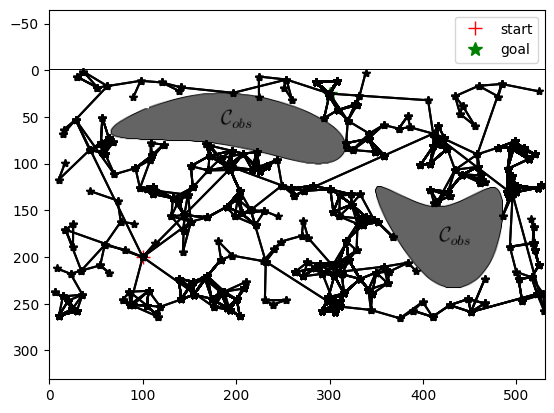
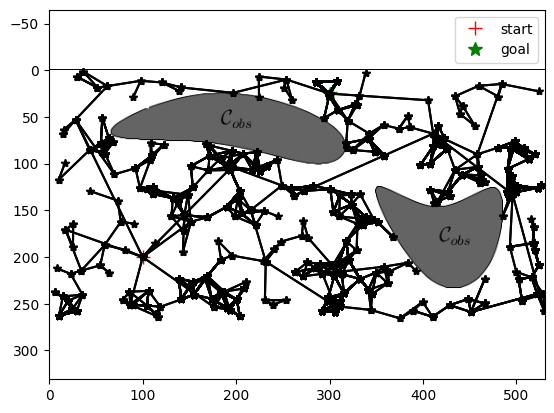
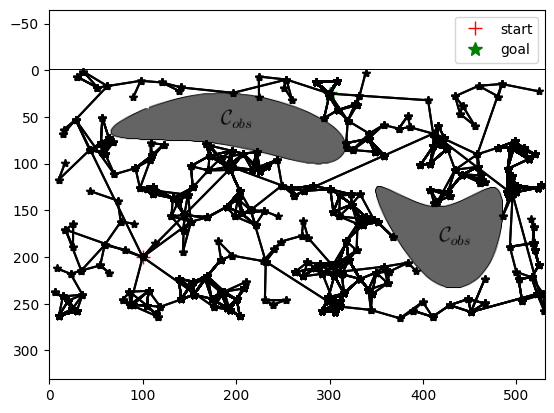
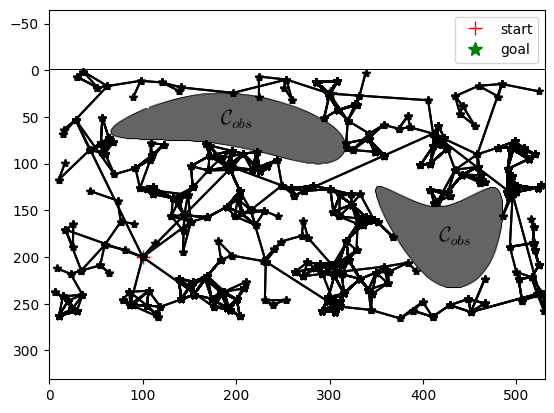
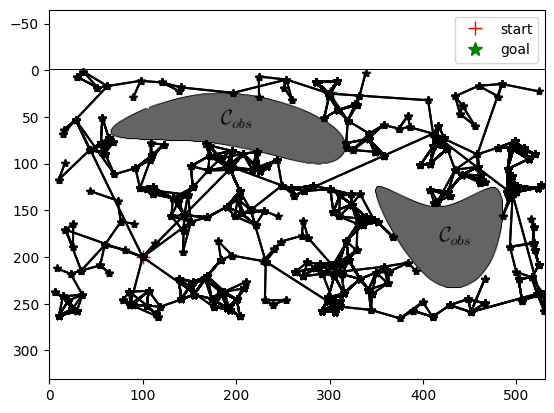
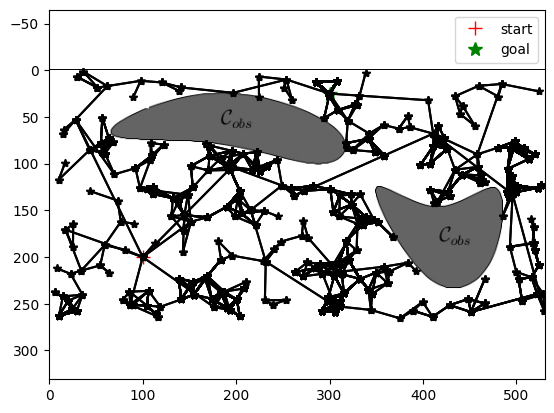
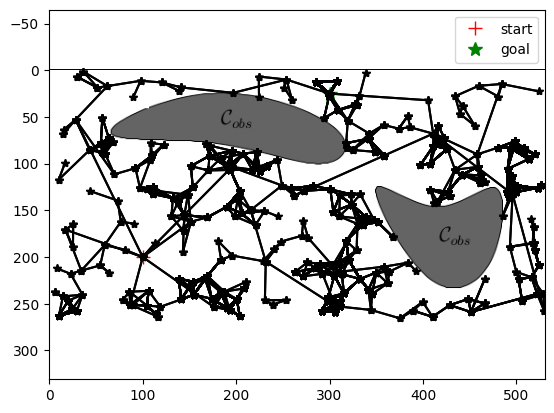
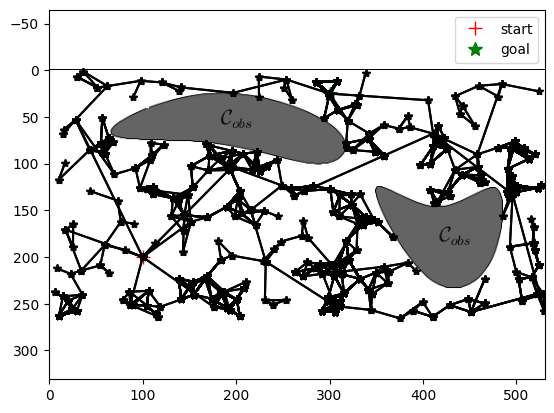
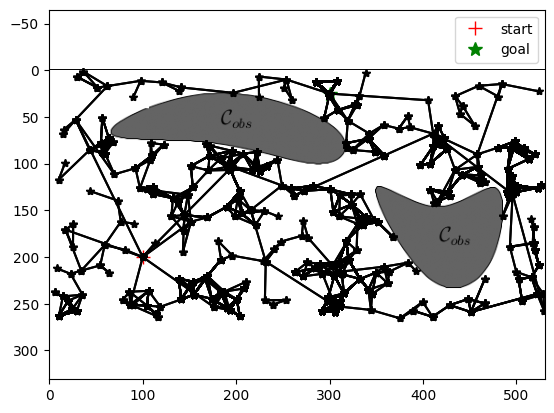
/home/vdhiman/.local/venvs/ece490/lib/python3.10/site-packages/IPython/core/pylabtools.py:170: UserWarning: Creating legend with loc="best" can be slow with large amounts of data.
  fig.canvas.print_figure(bytes_io, **kw)
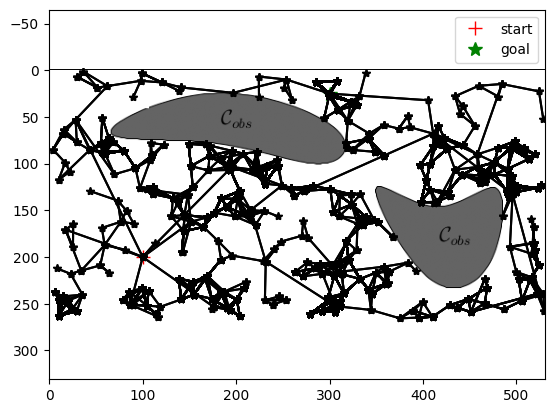
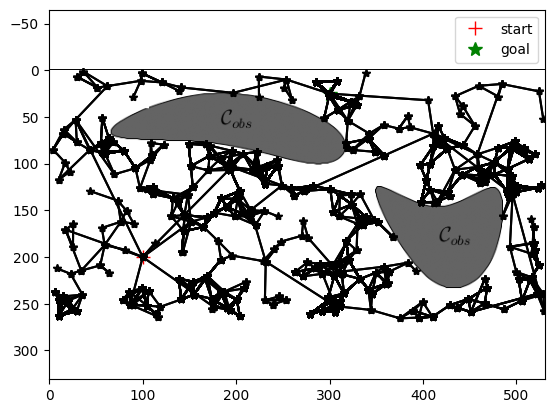
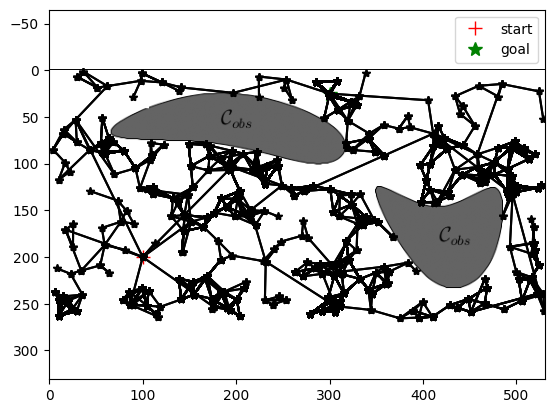
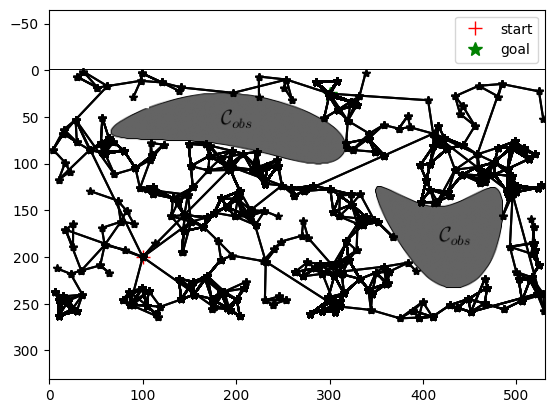
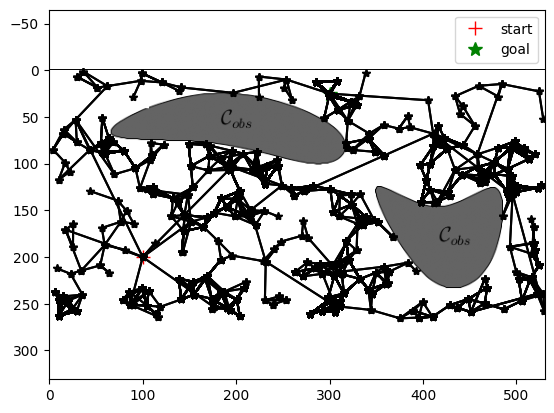
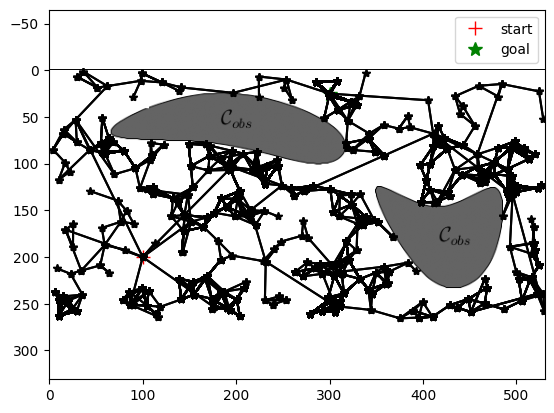
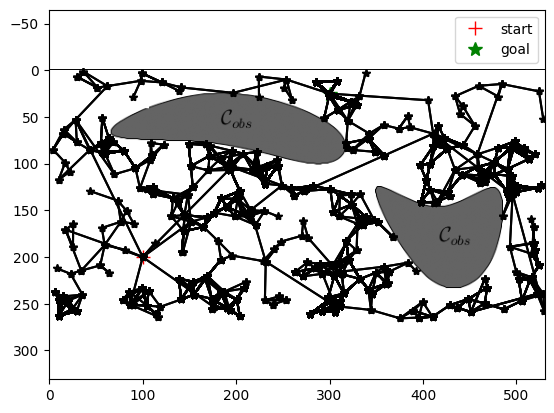
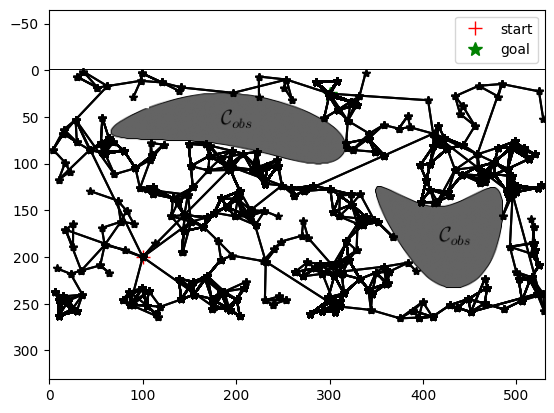
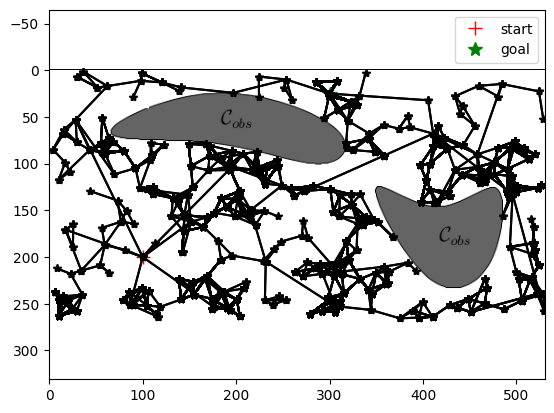
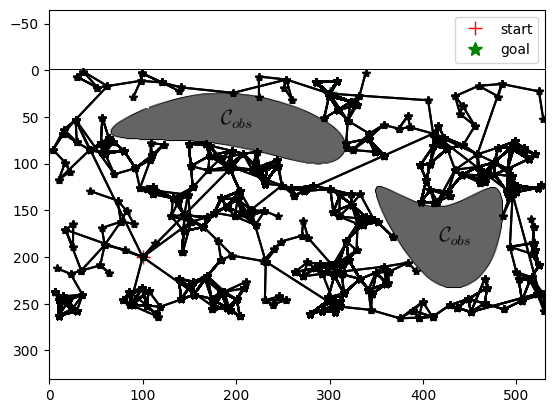
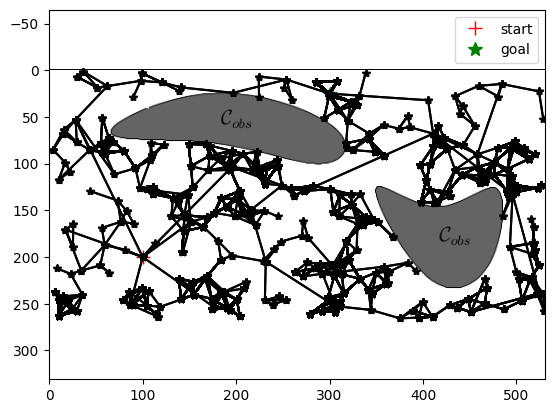
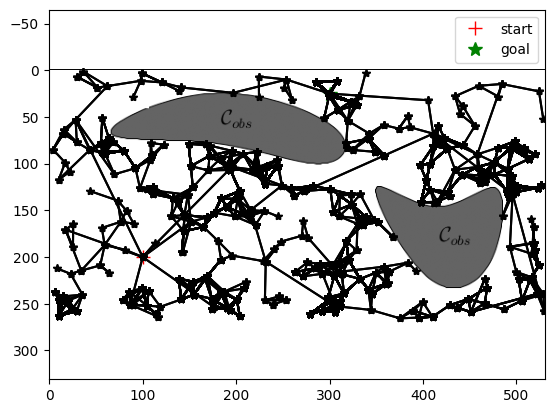
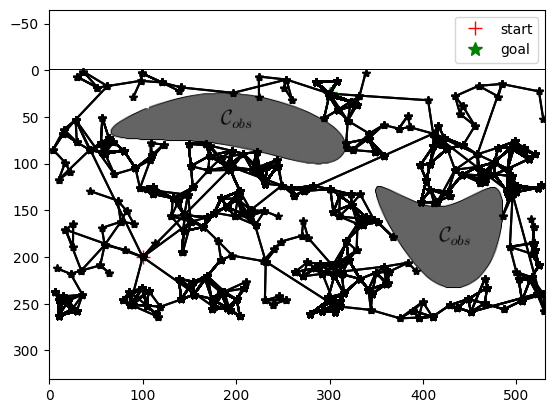
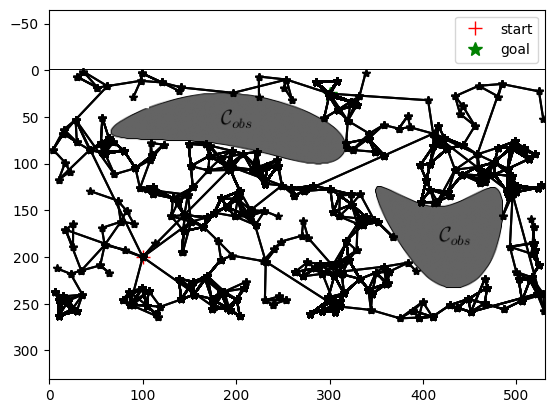
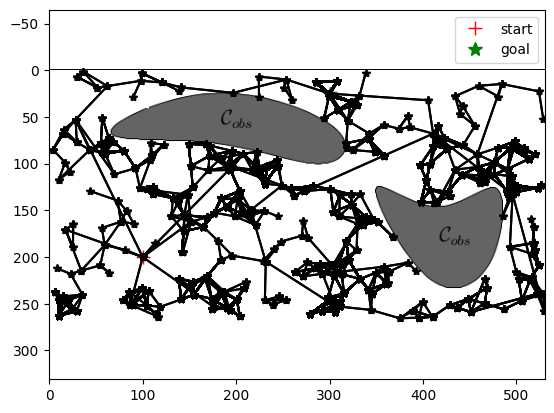
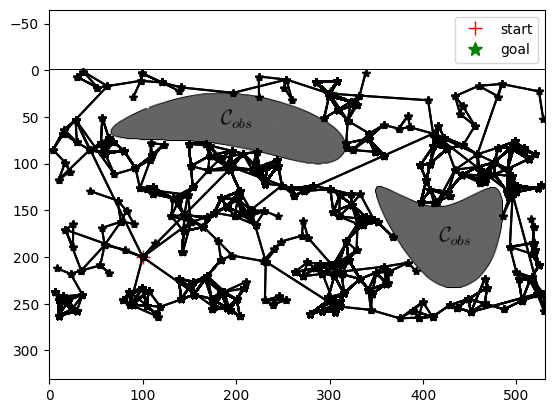
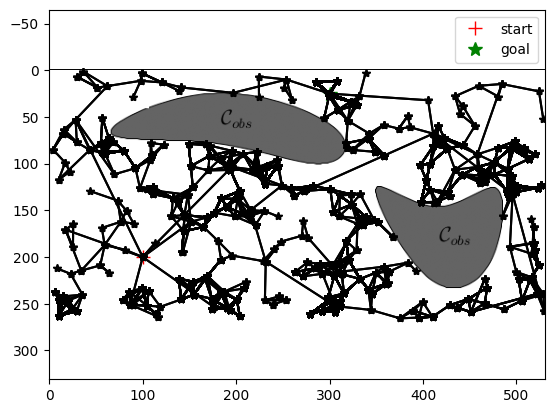
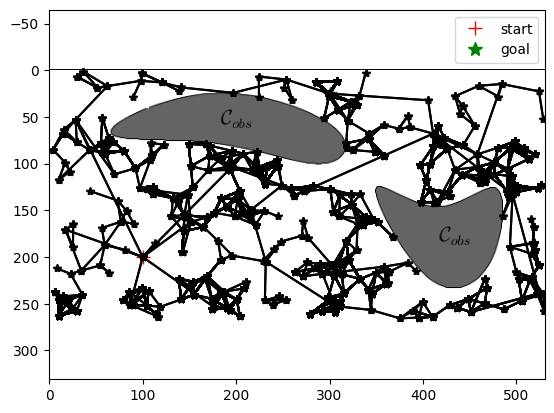
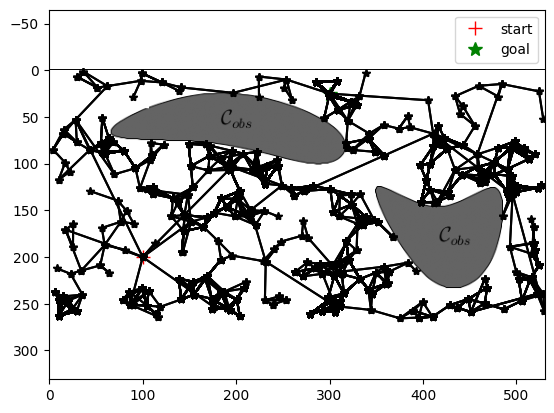
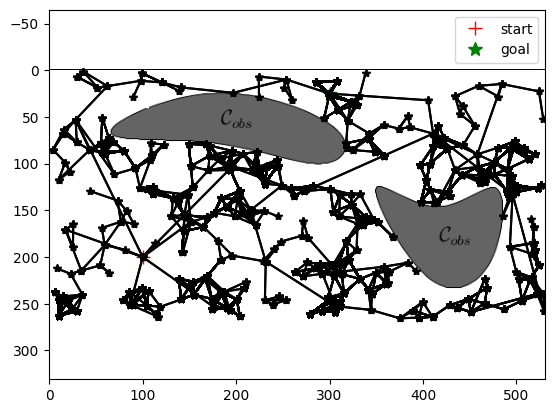
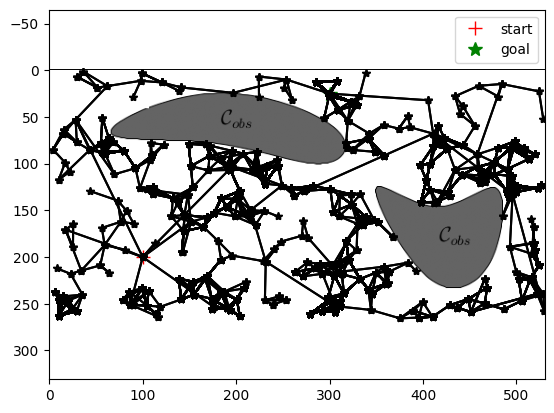
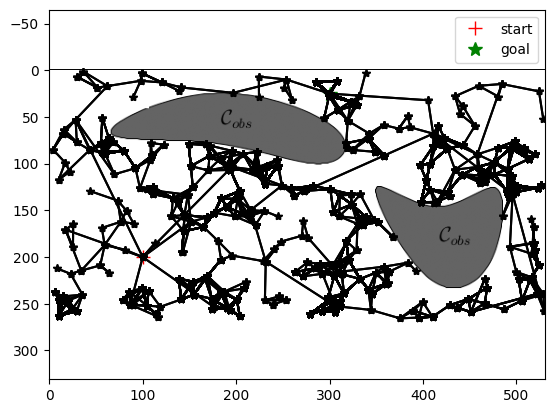
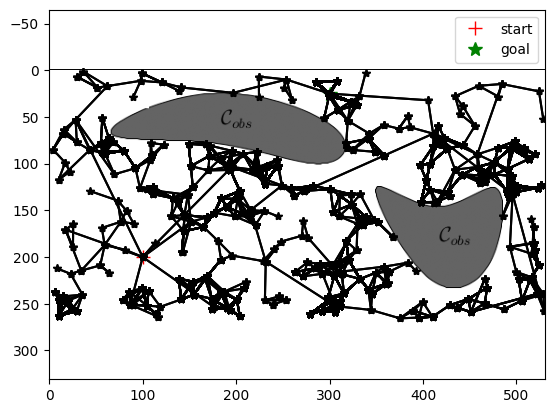
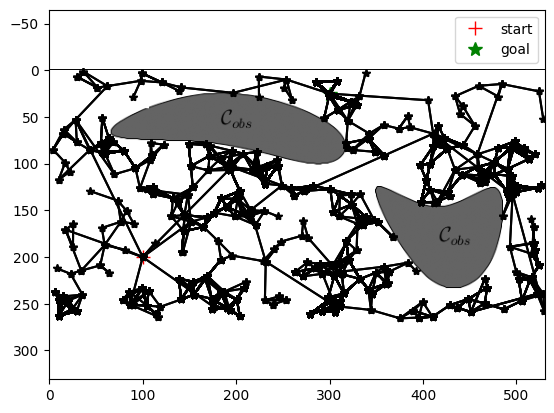
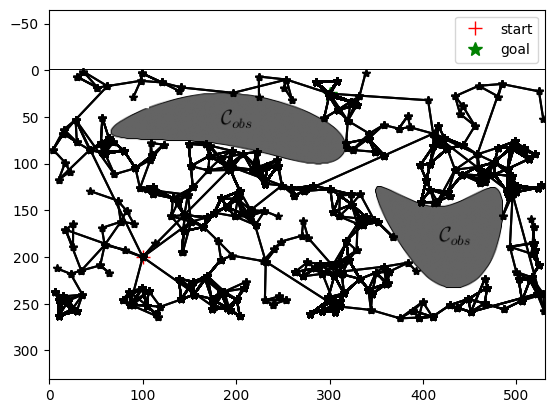
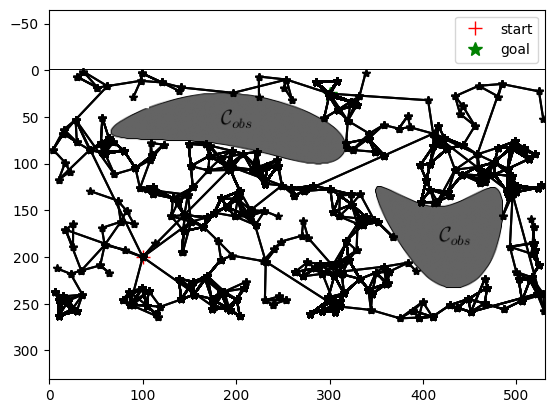
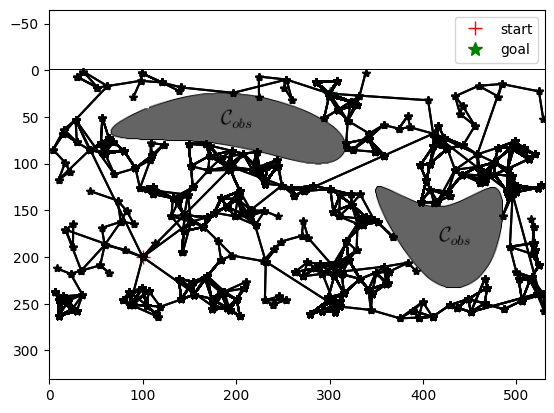
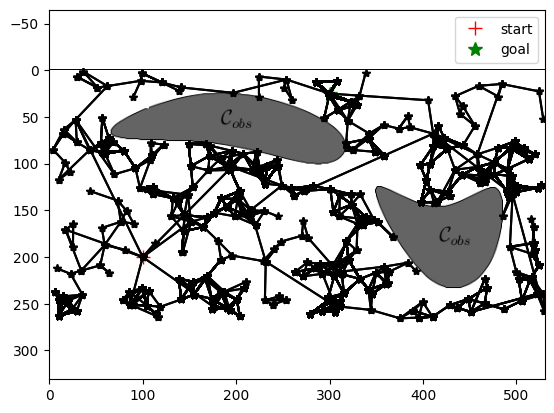
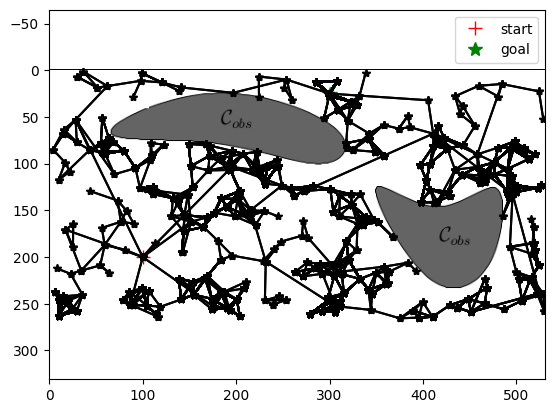
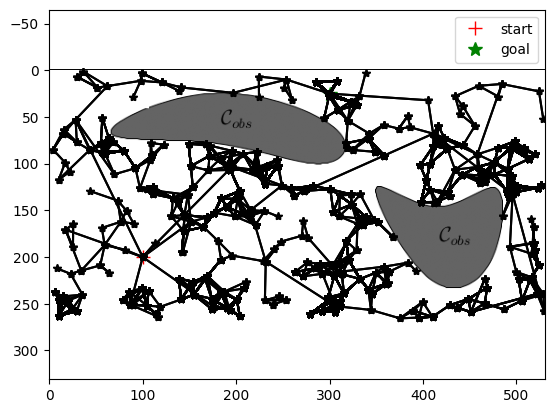
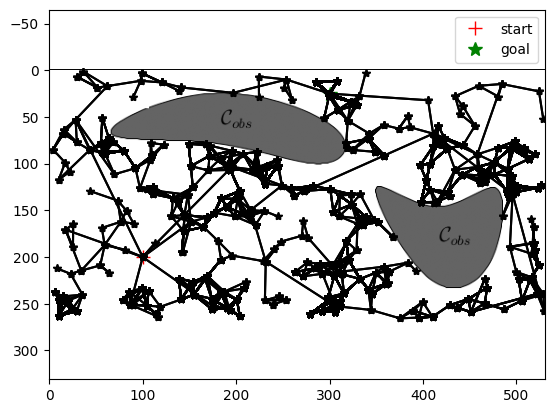
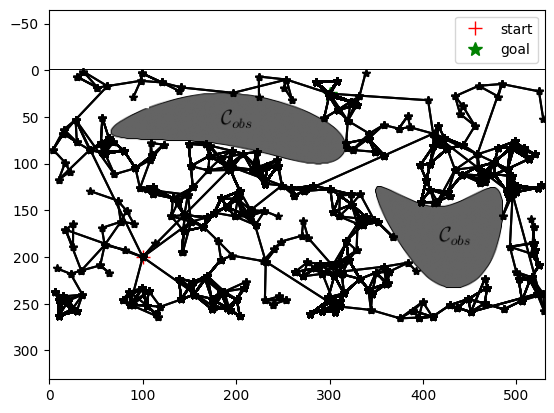
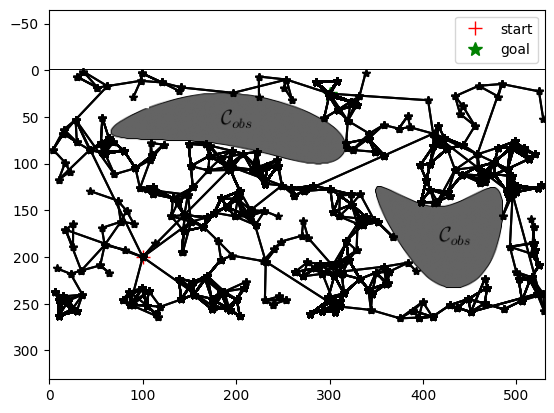
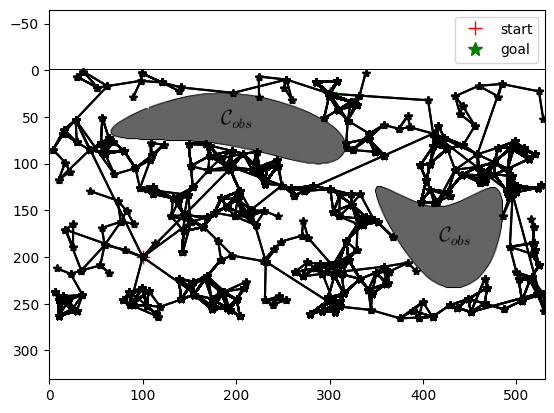
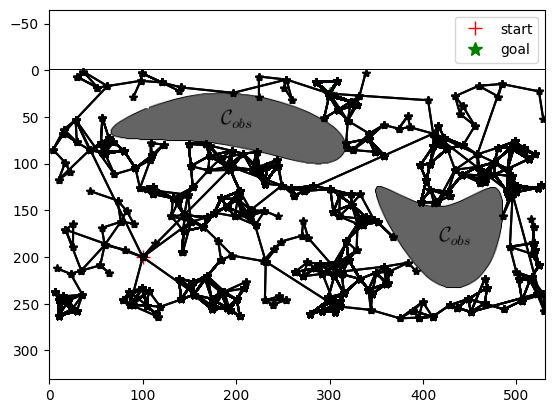
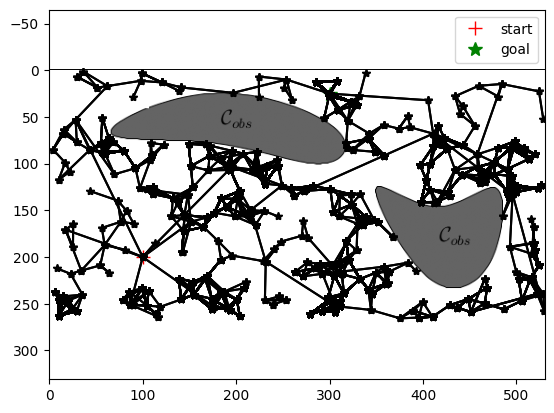
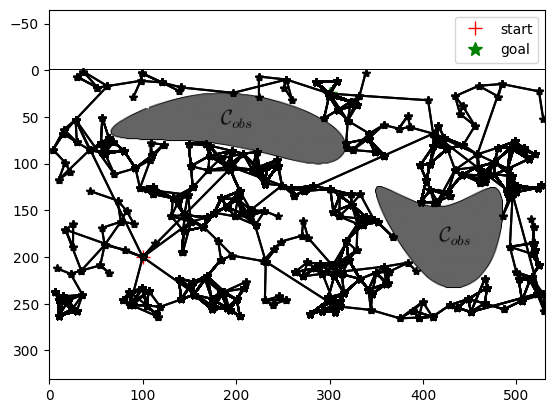
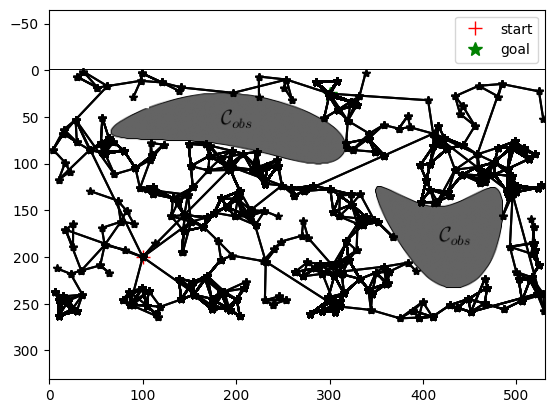
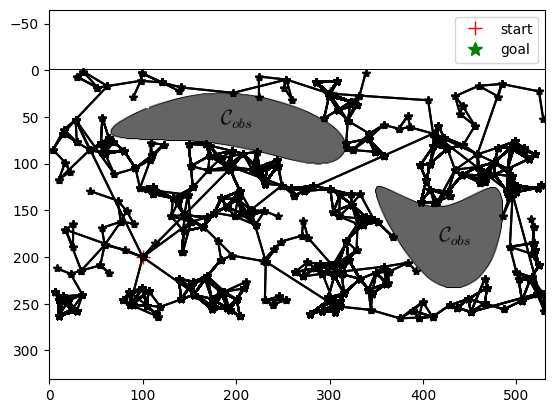
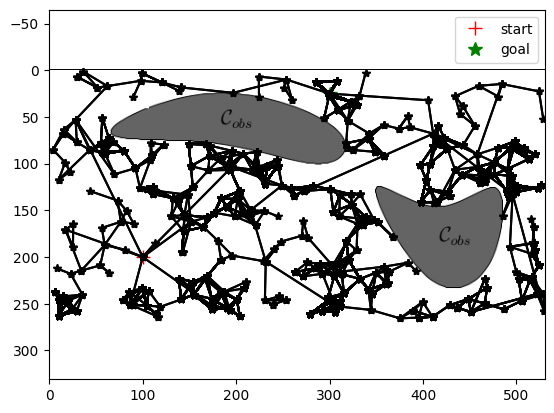
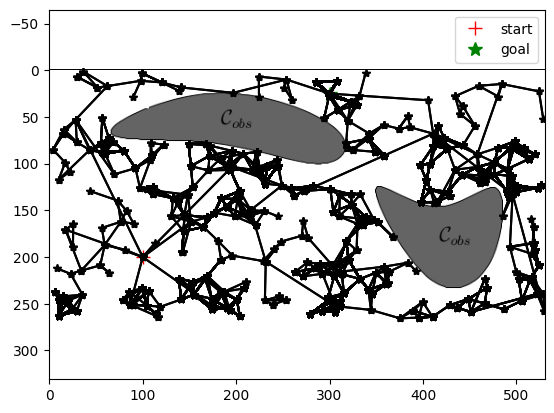
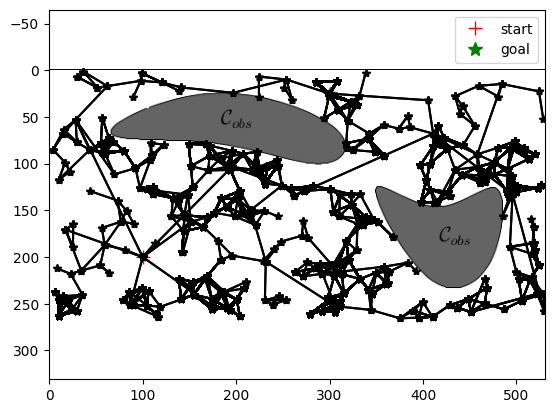
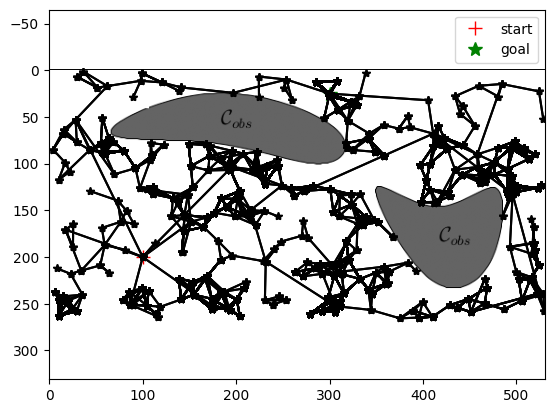
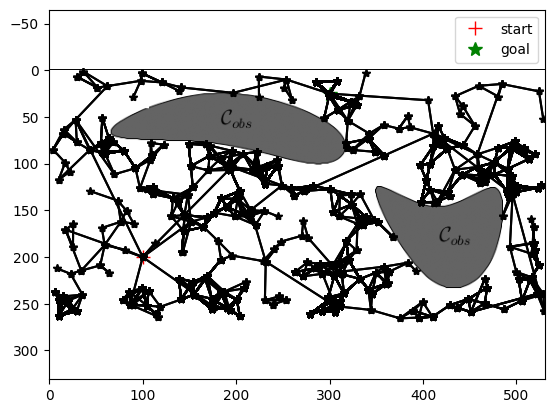
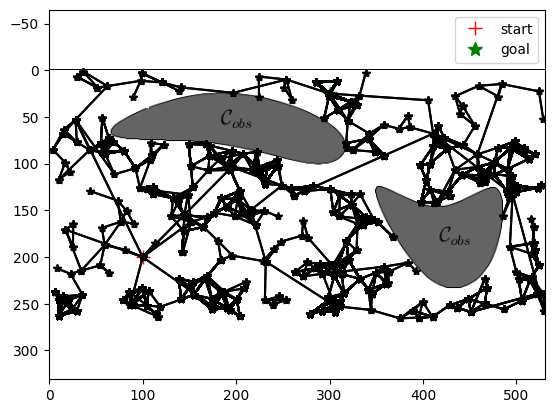
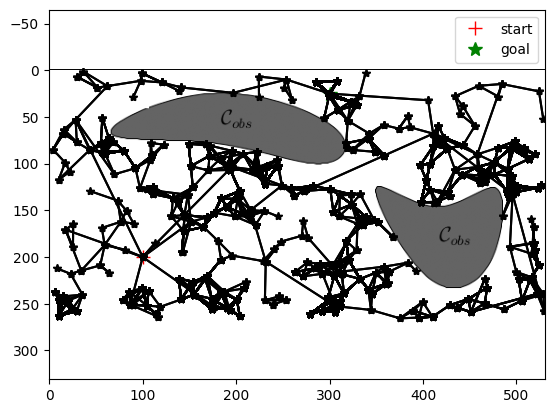
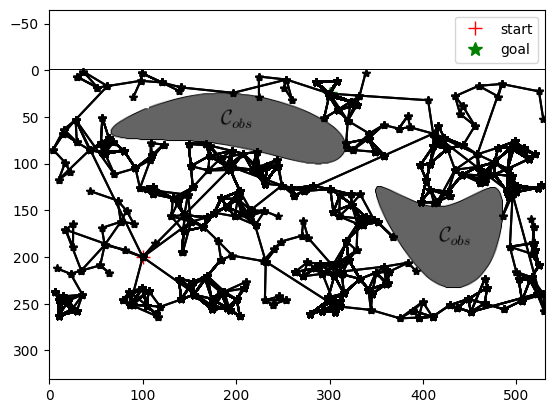
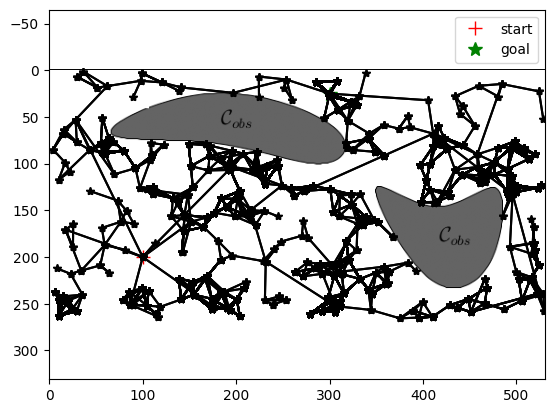
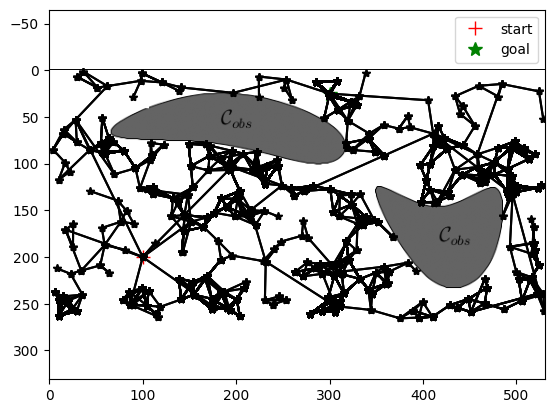
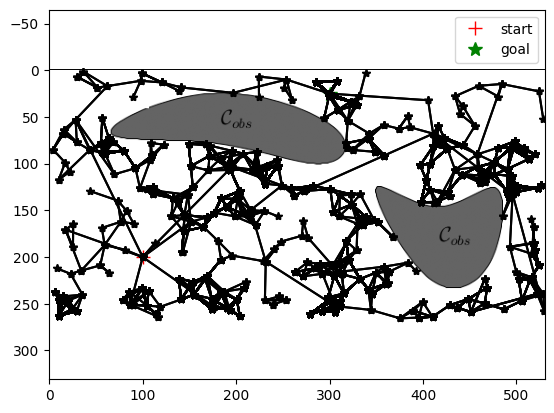
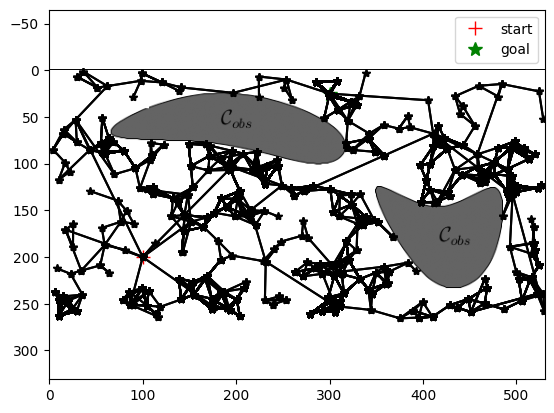
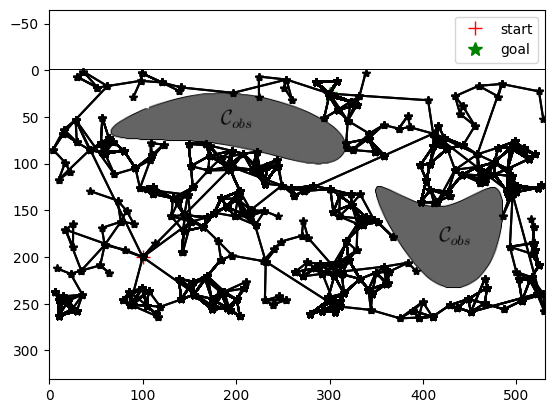
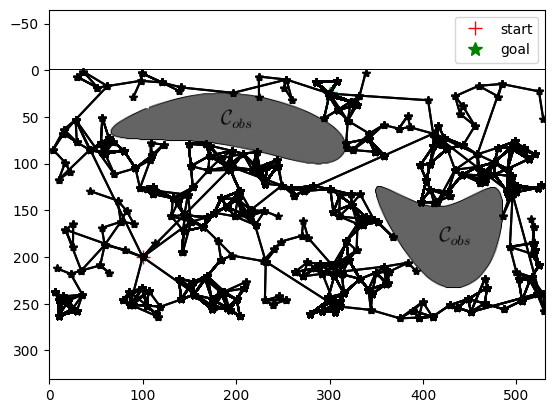
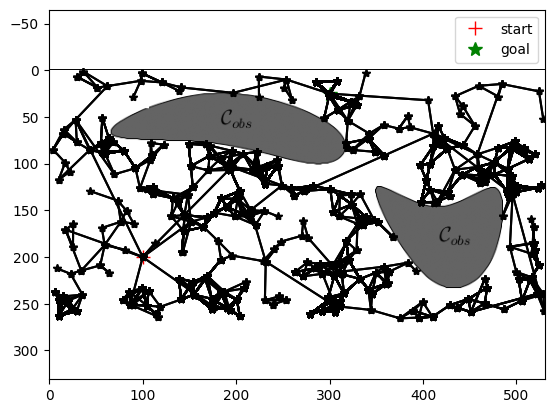
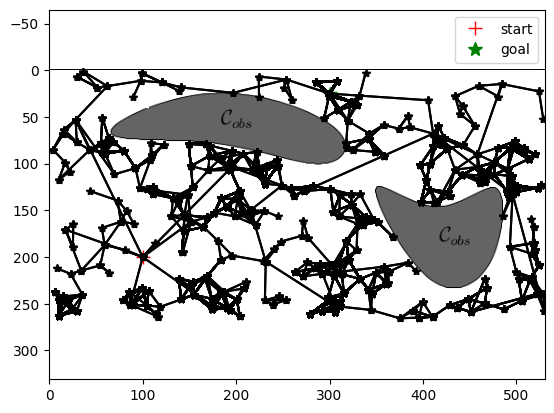
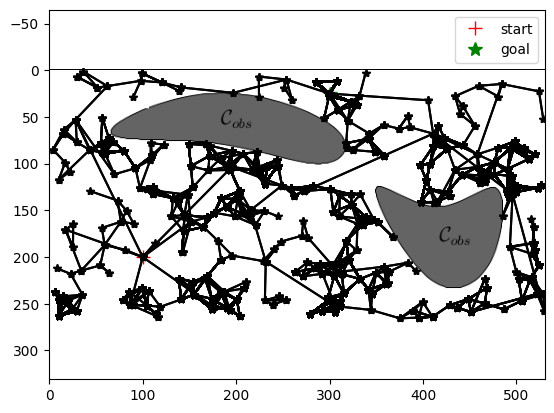
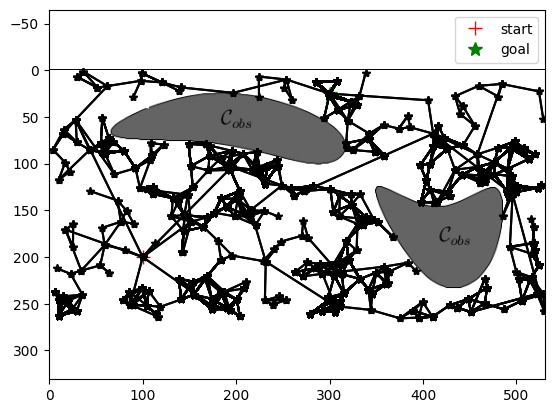
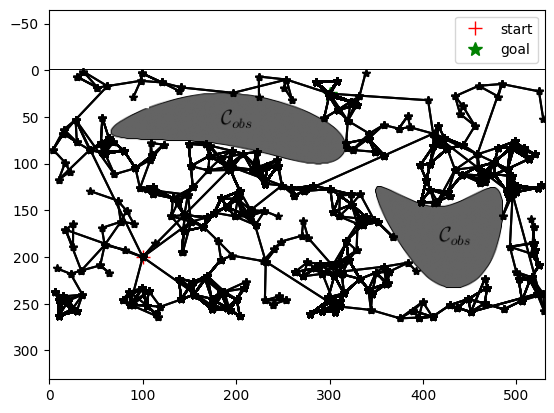
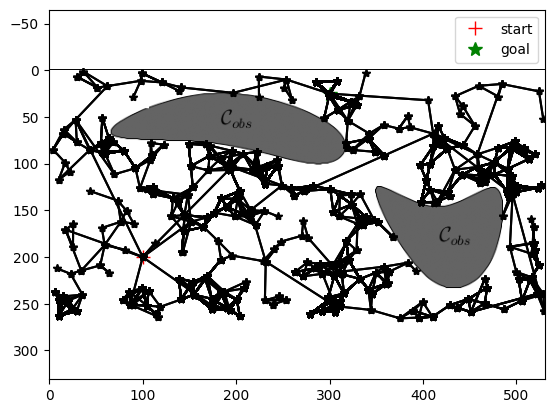
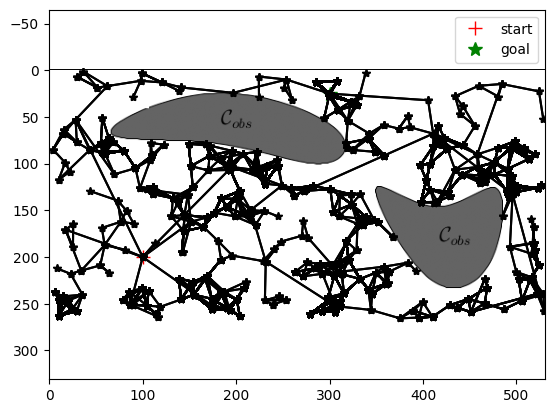
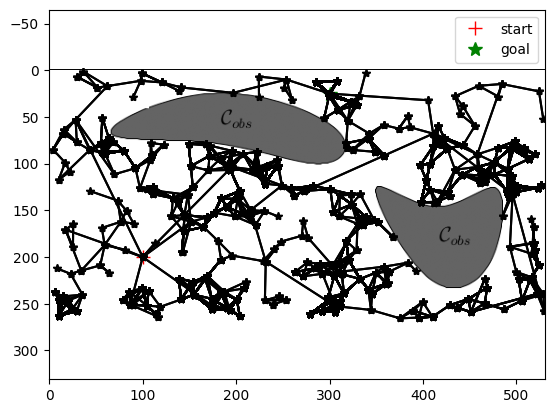
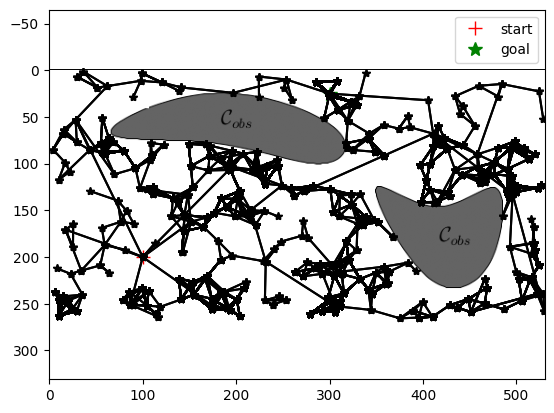
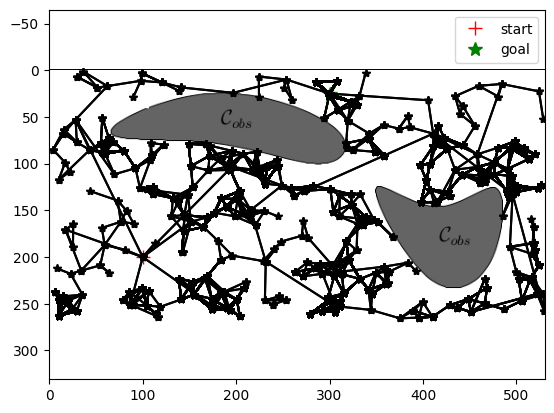
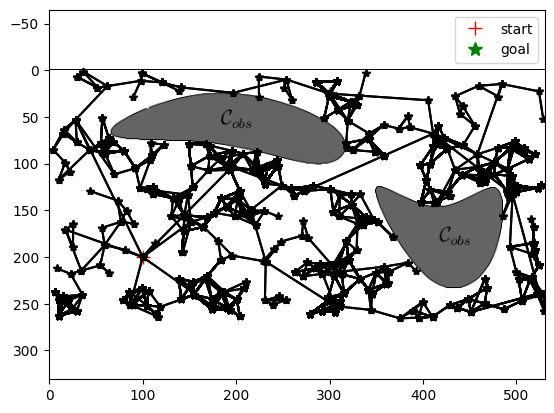
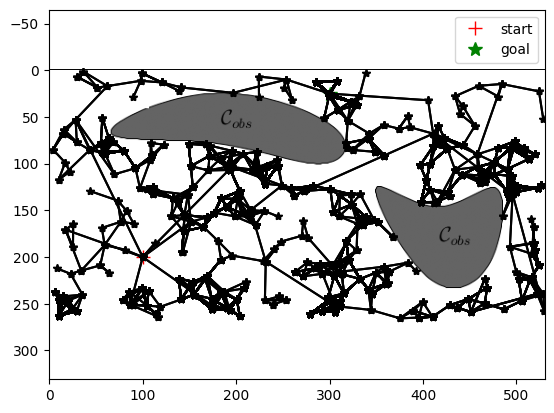
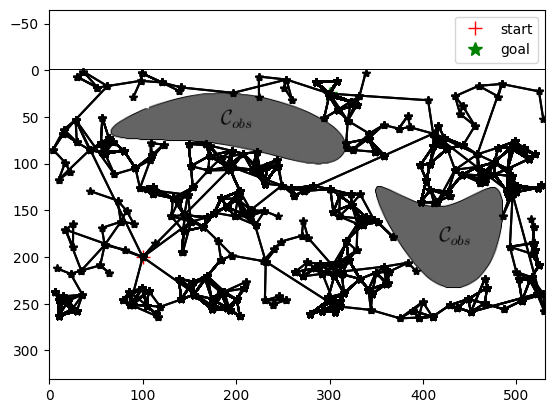
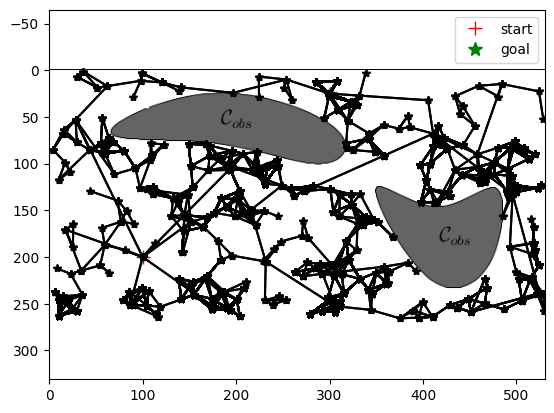
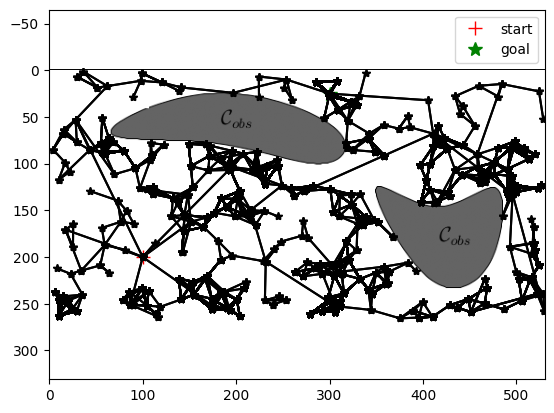
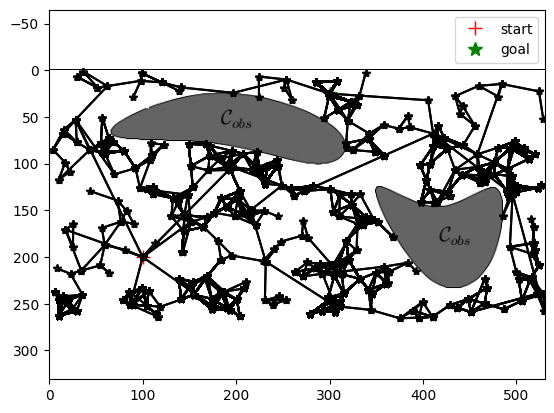
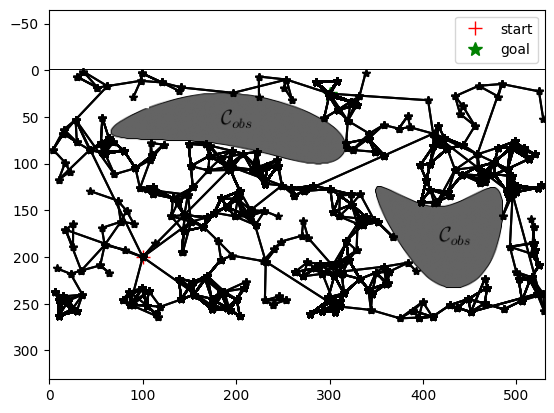
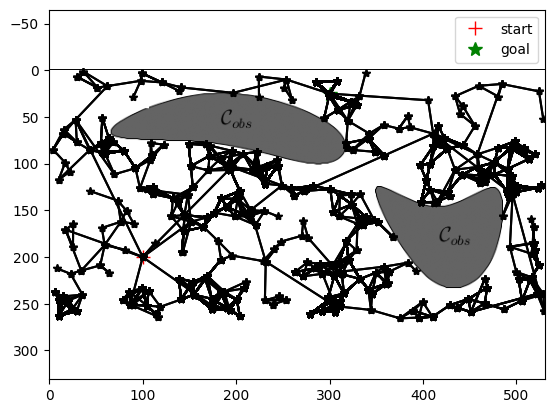
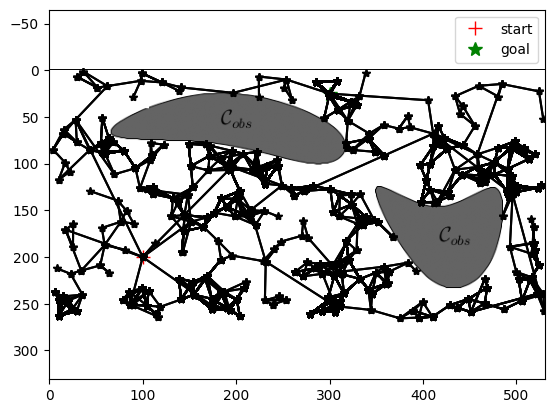
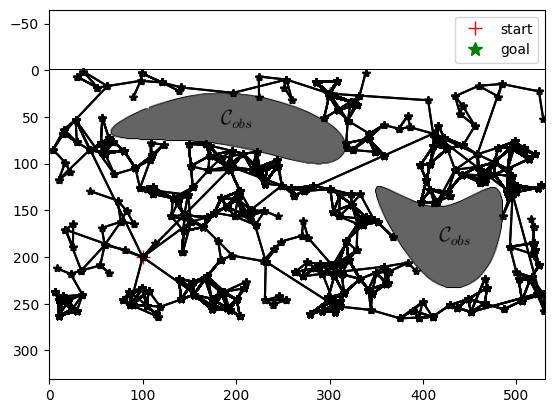
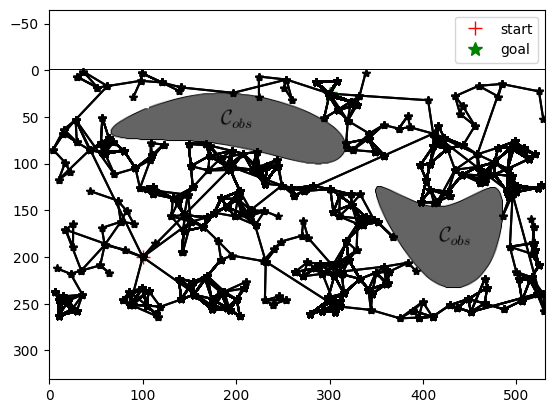
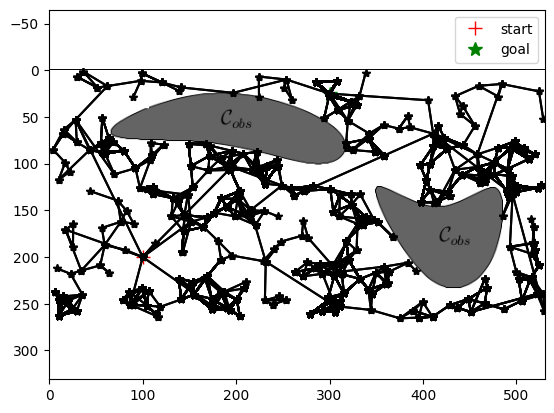
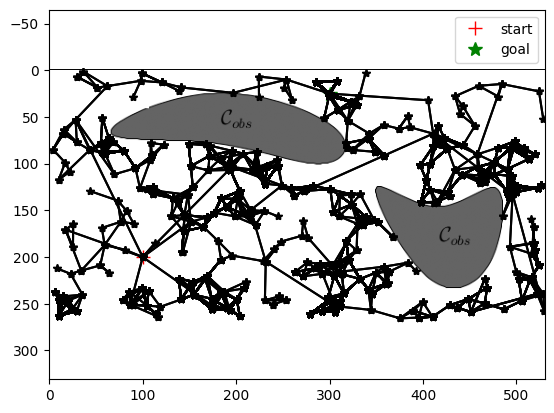
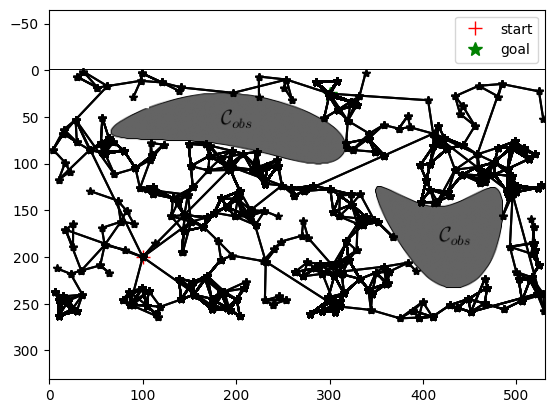
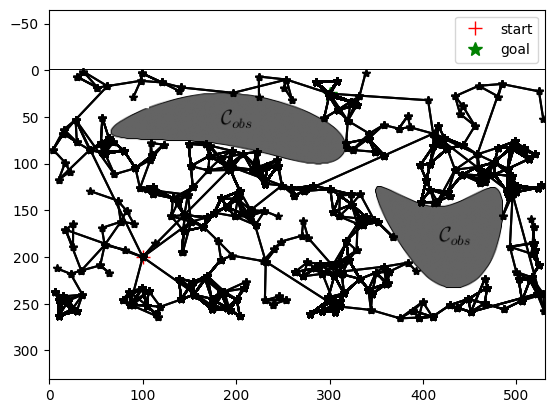
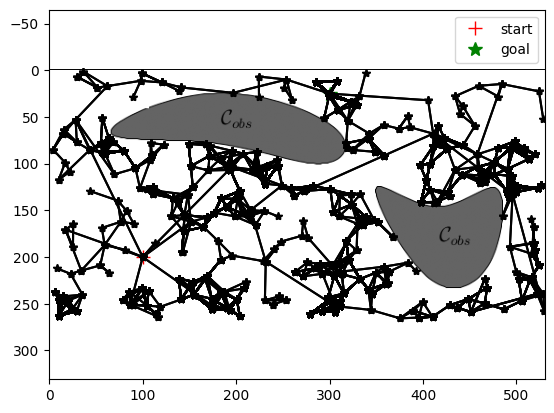
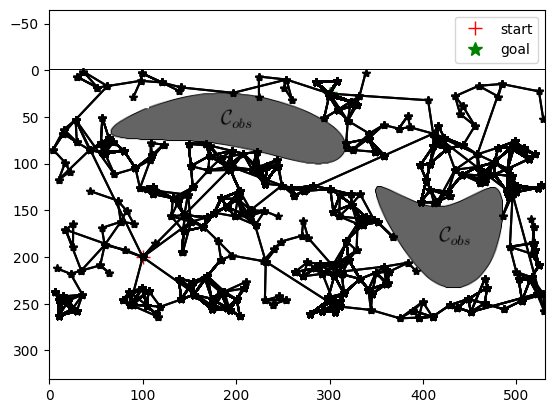
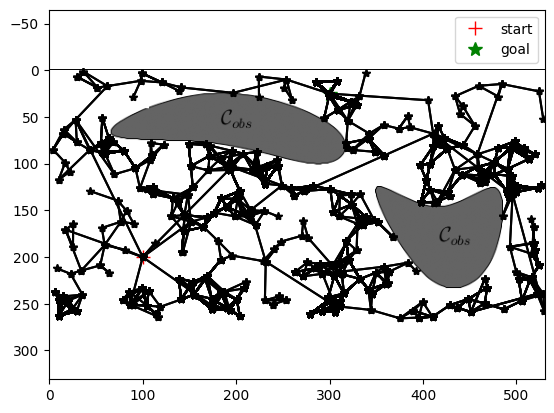
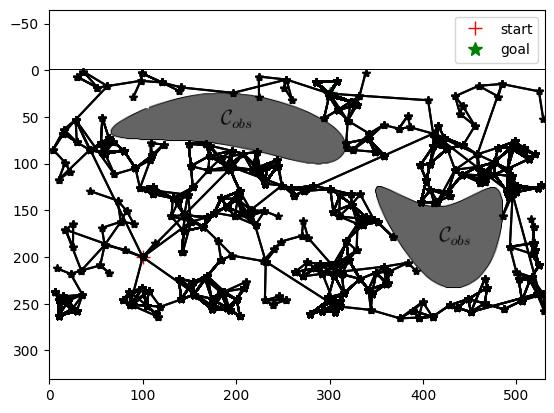
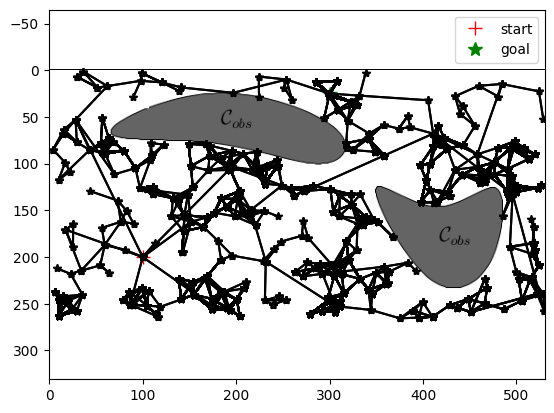
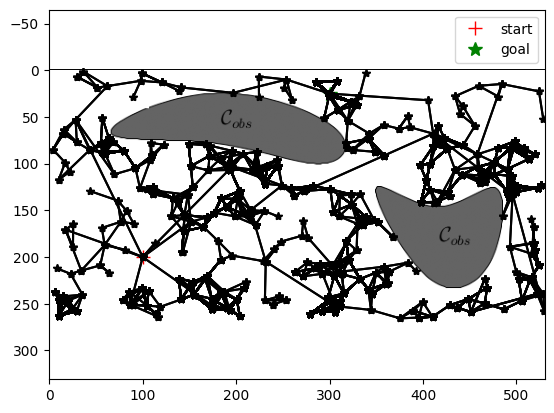
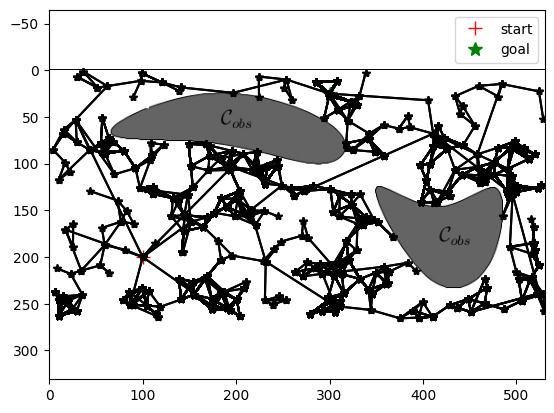
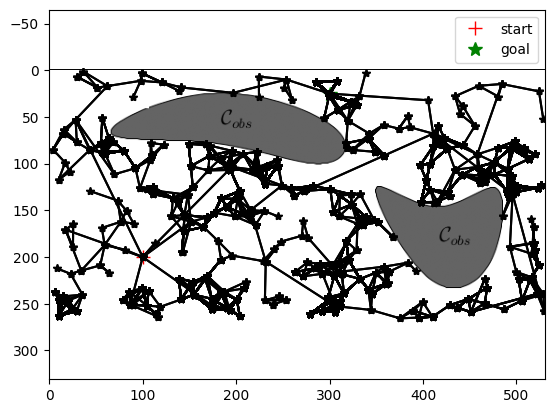
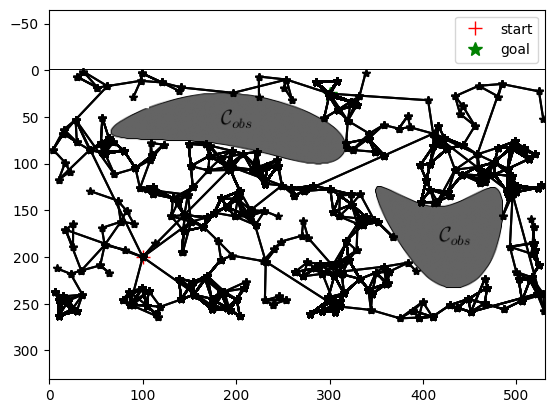
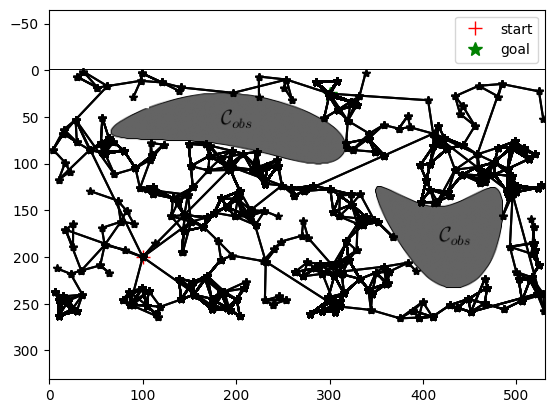
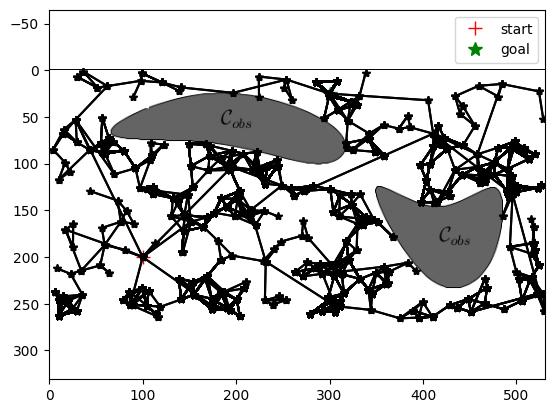
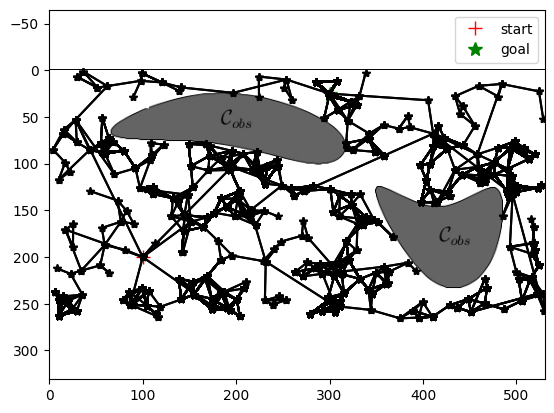
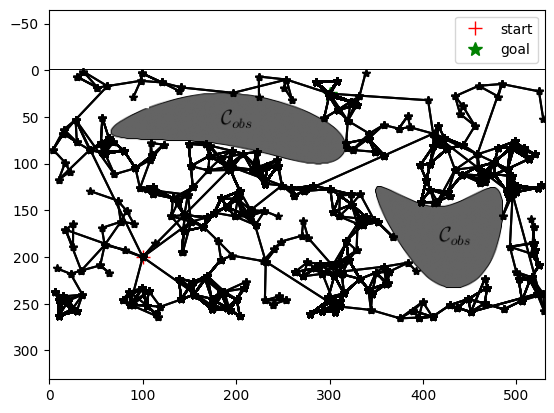
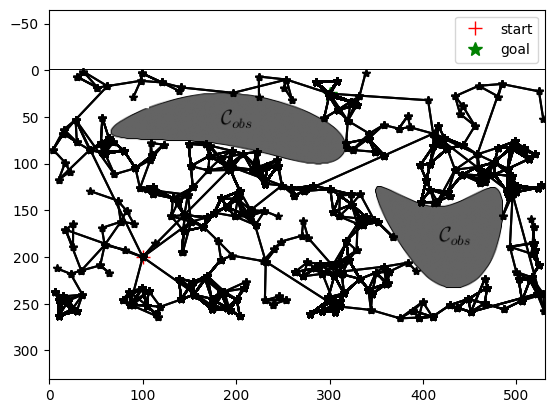
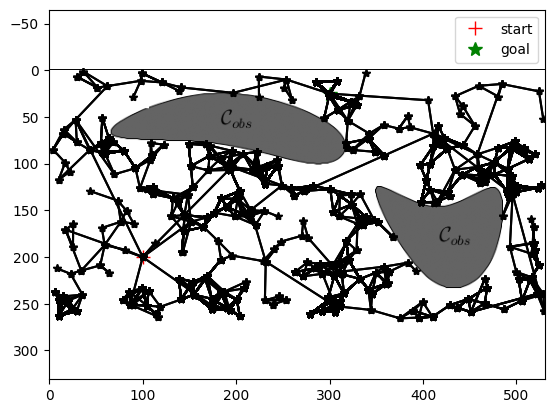
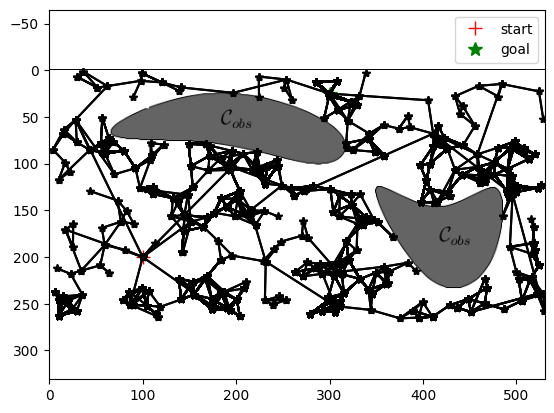
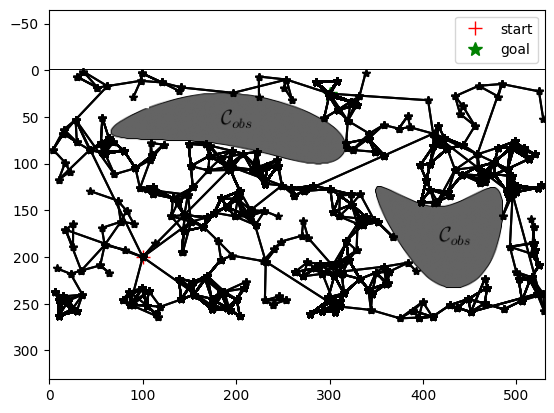
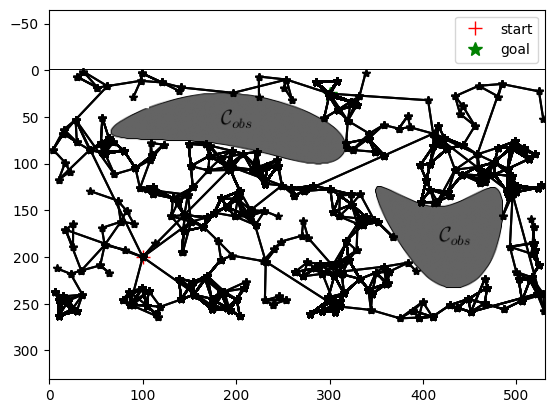
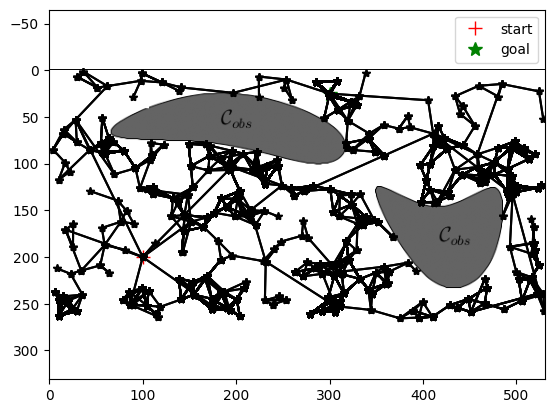
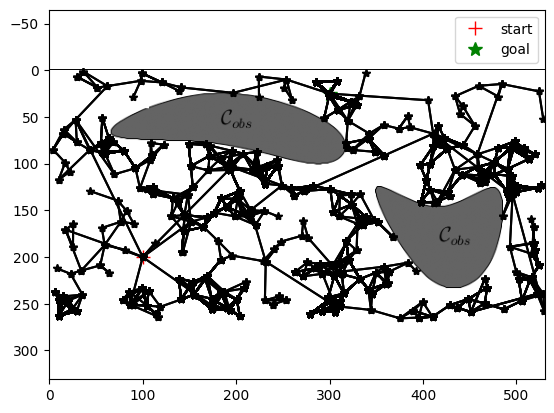
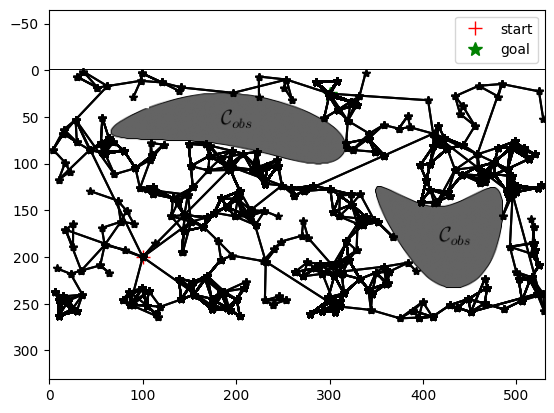
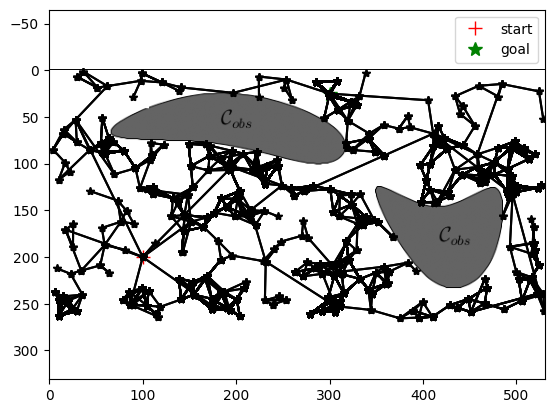
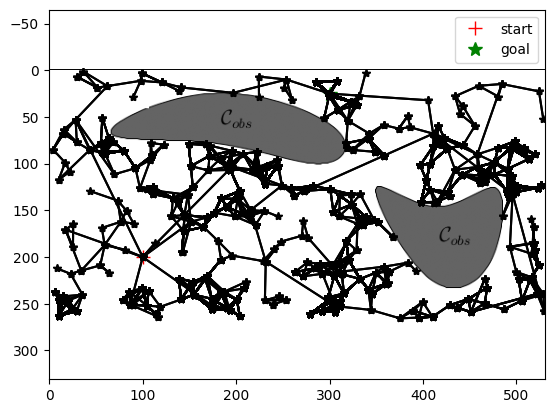
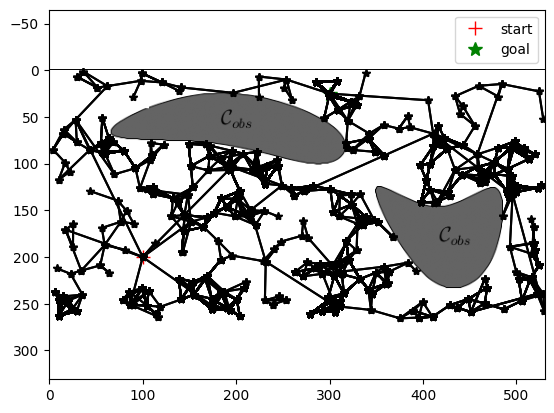
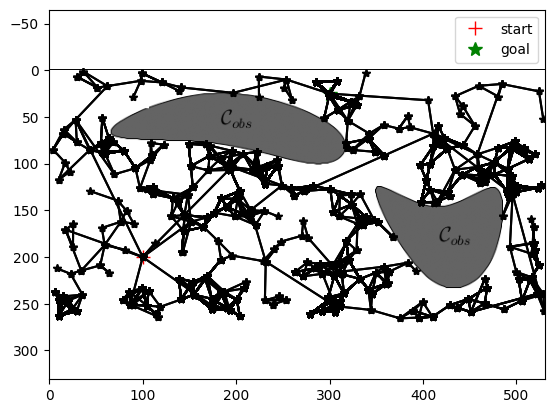
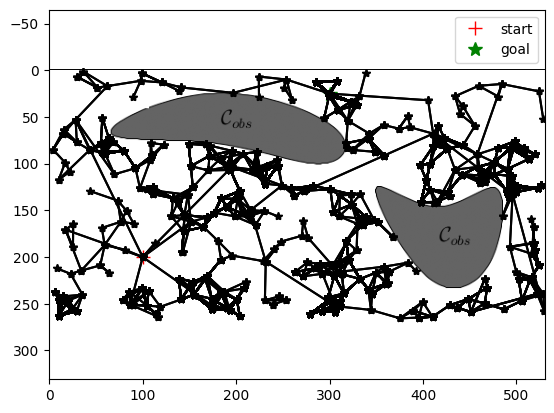
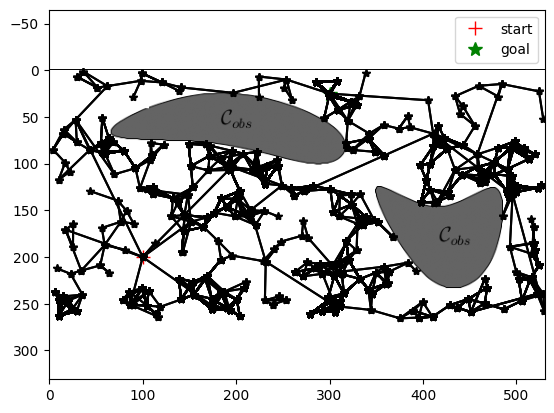
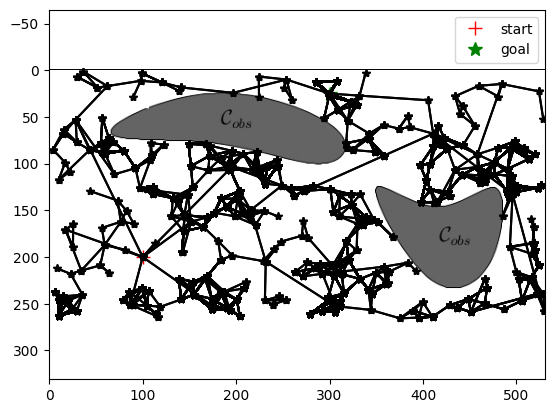
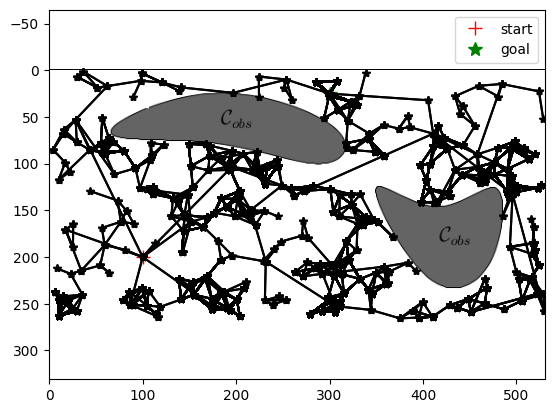
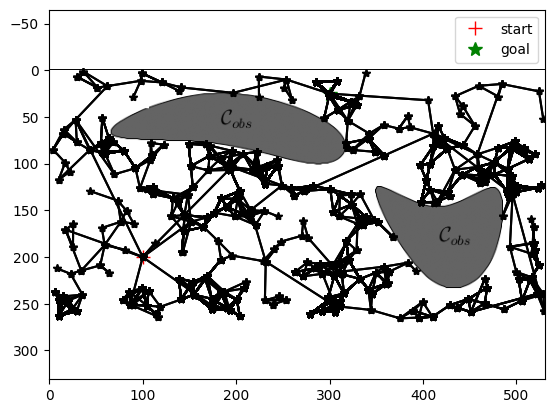
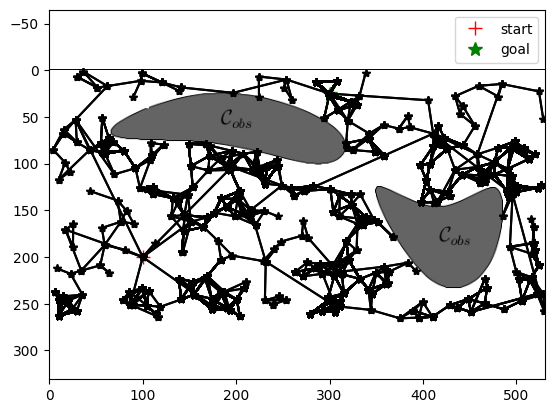
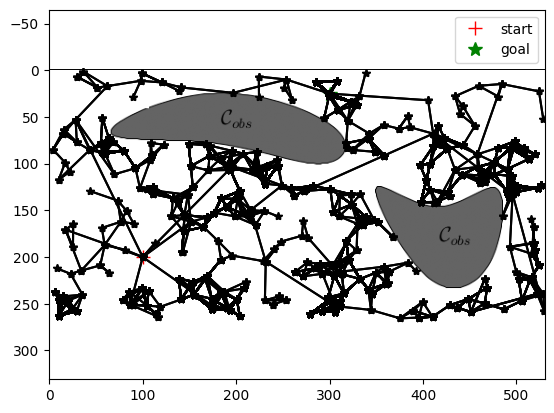
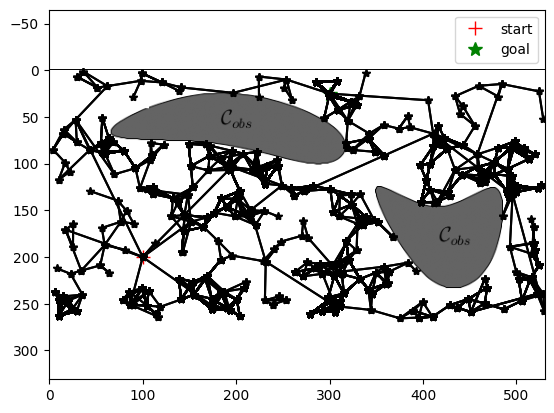
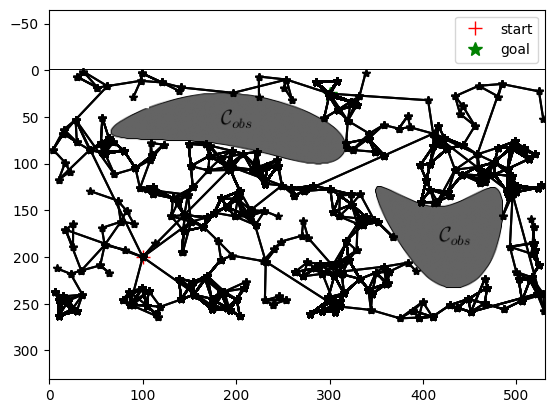
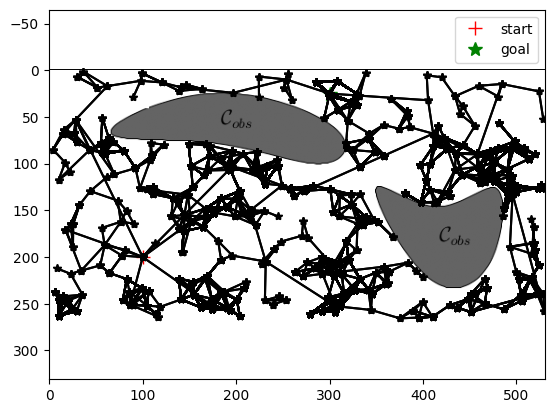
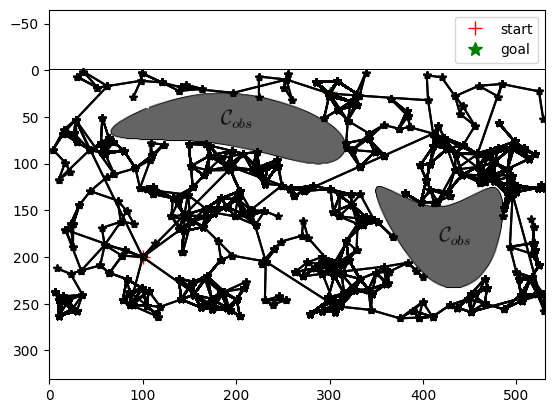
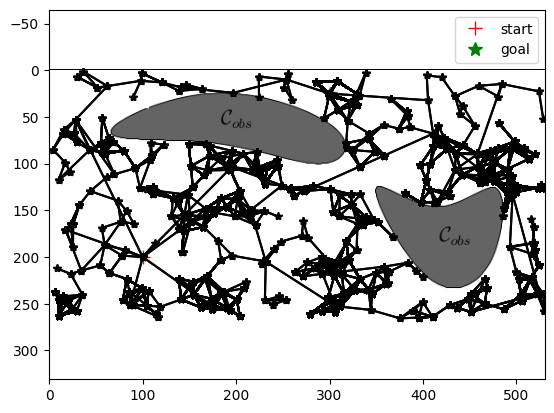
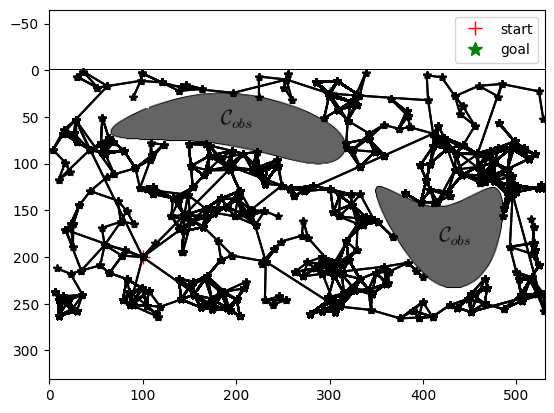
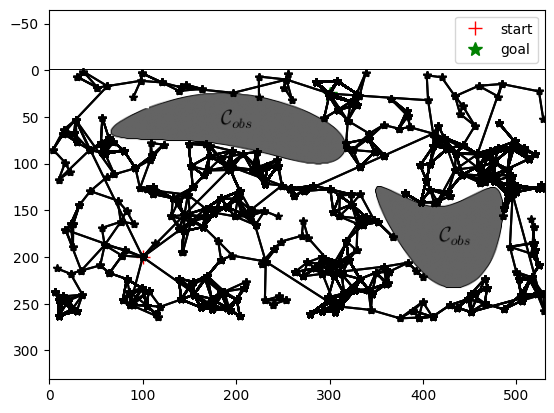
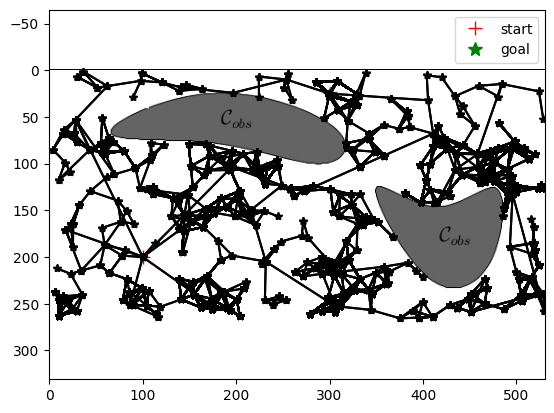
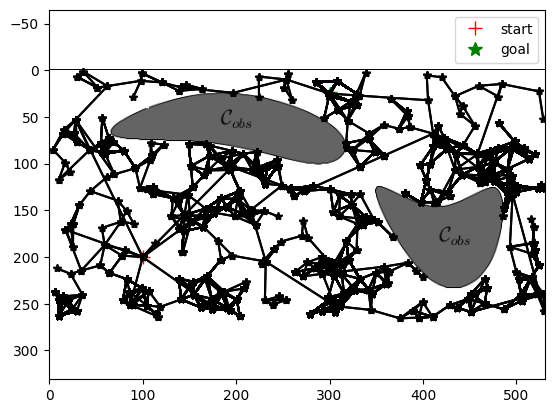
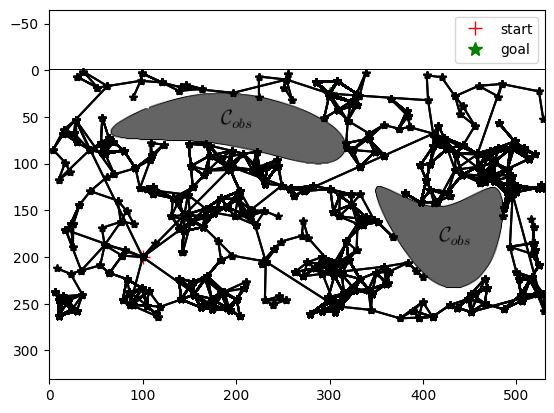
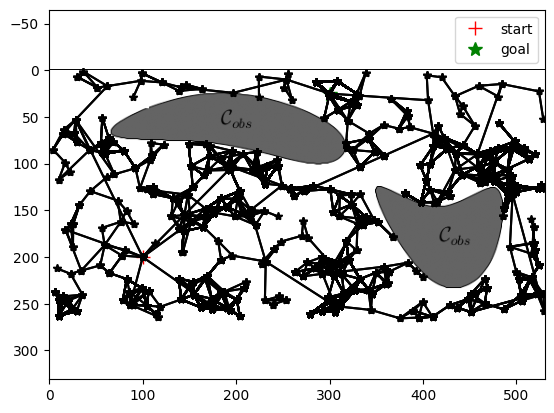
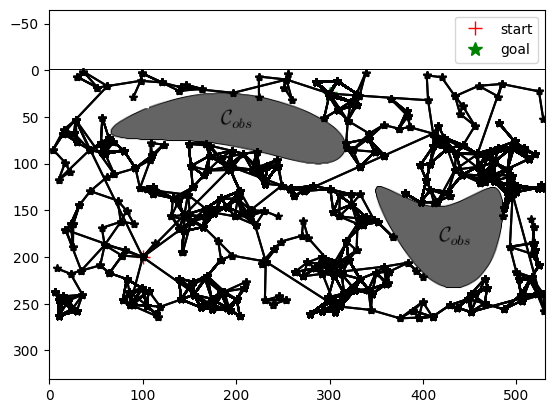
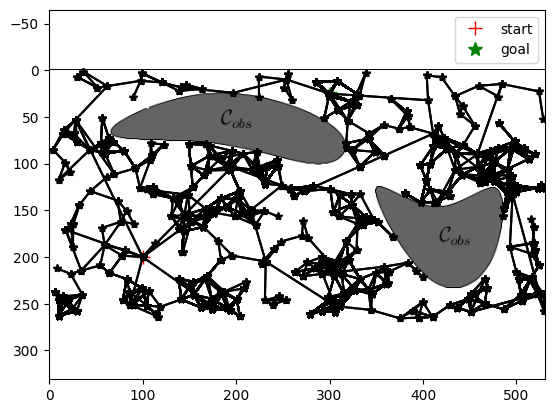
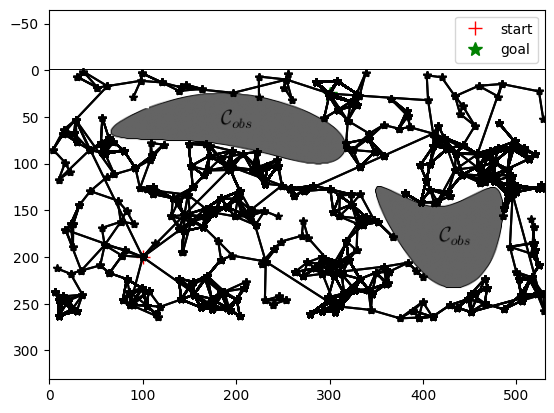
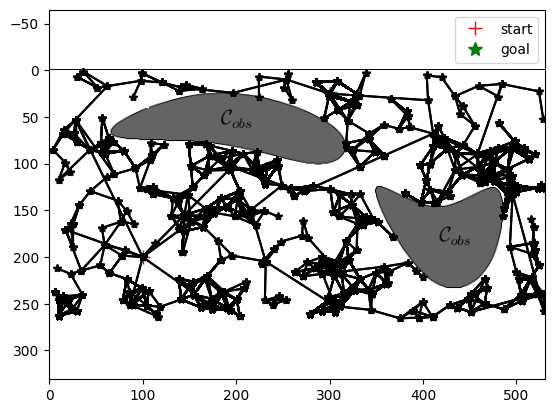
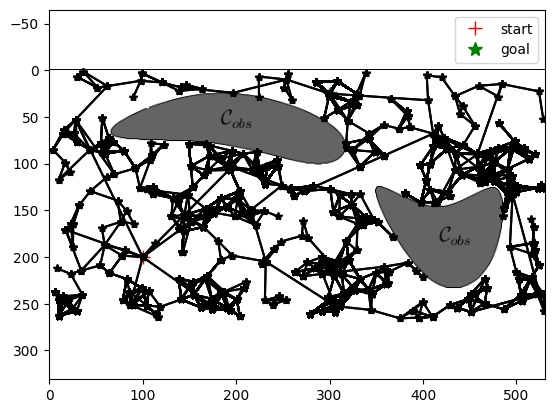
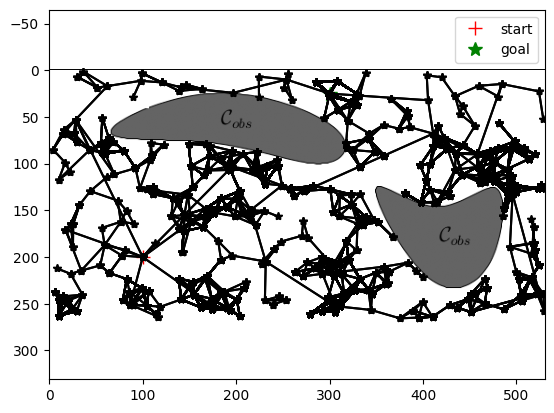
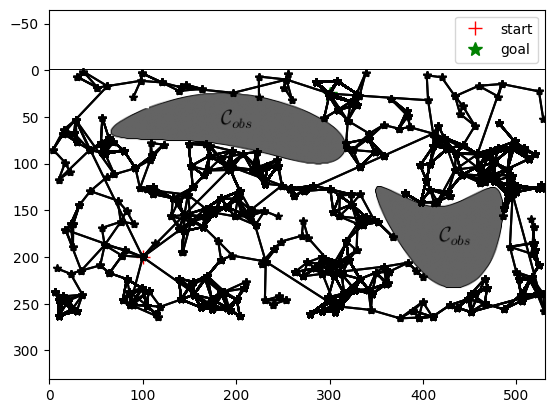
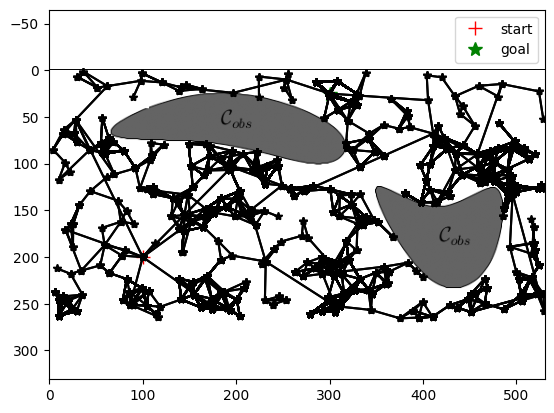
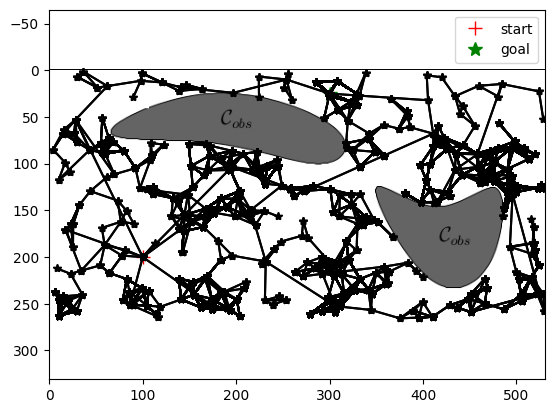
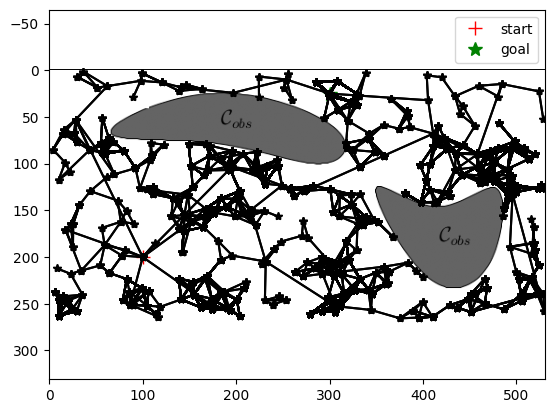
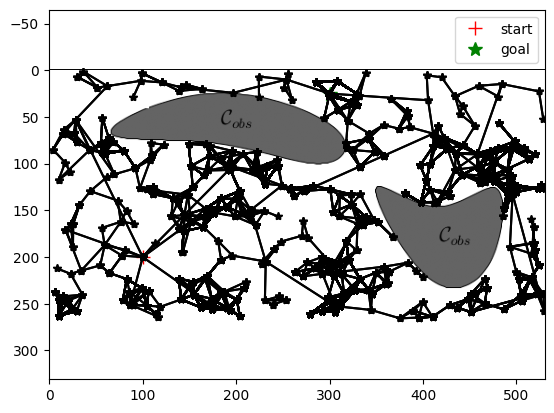
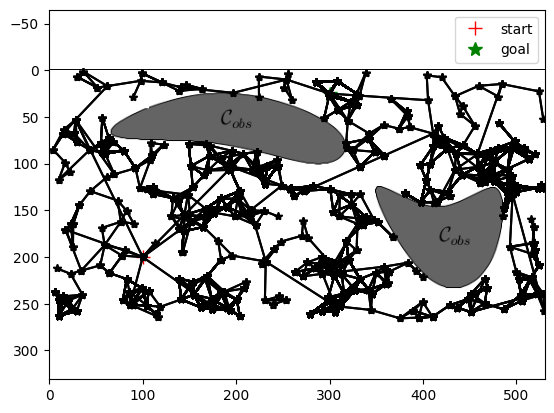
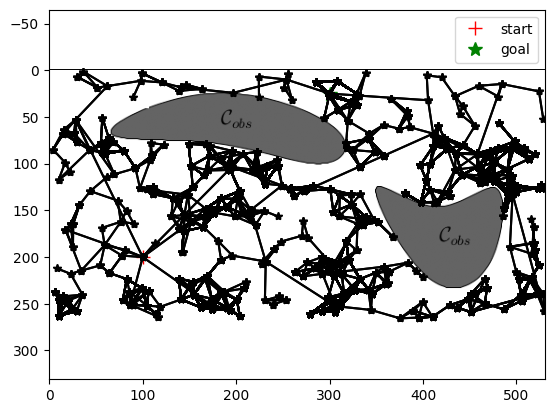
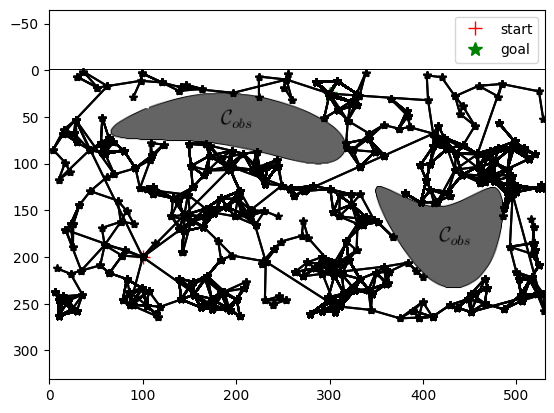
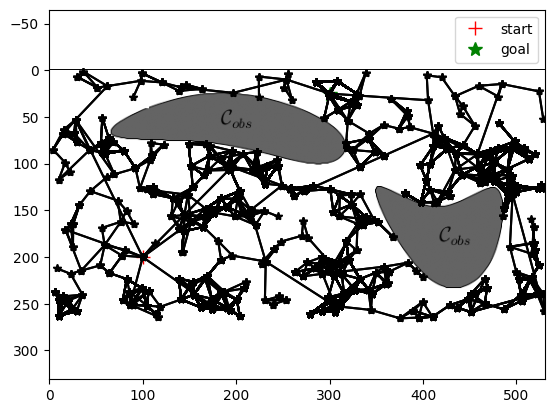
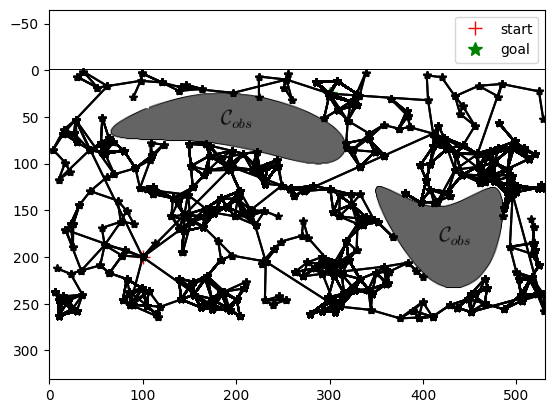
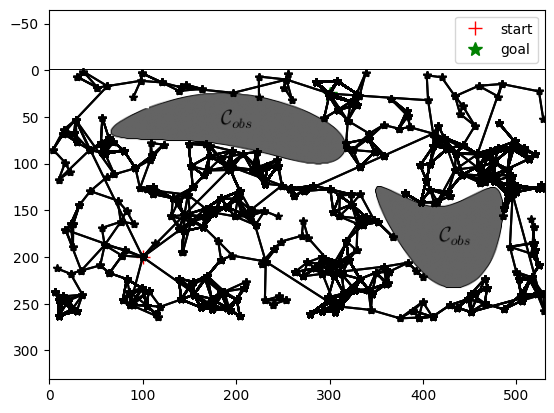
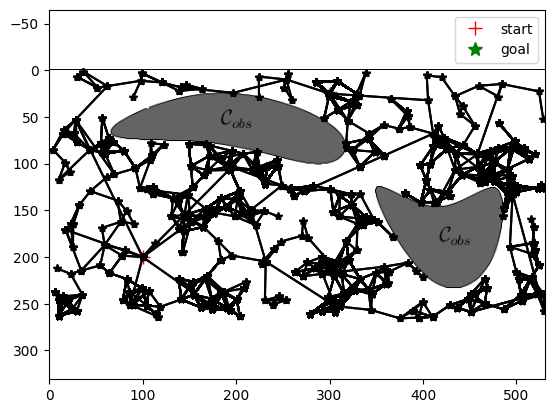
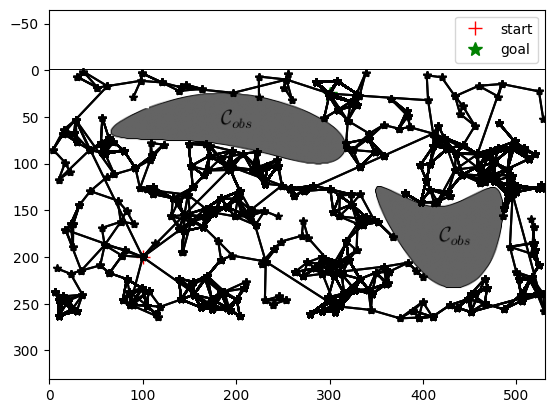
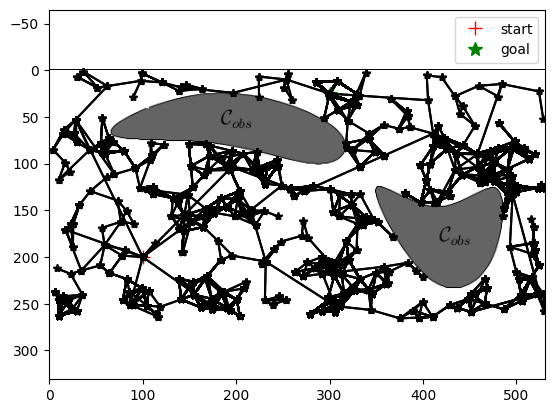
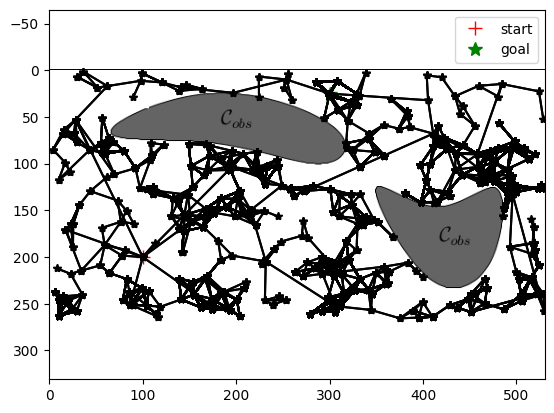
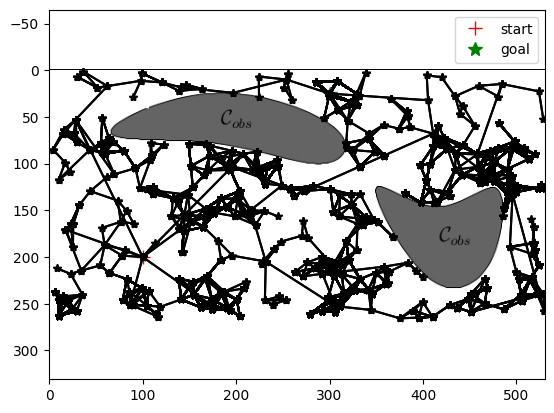
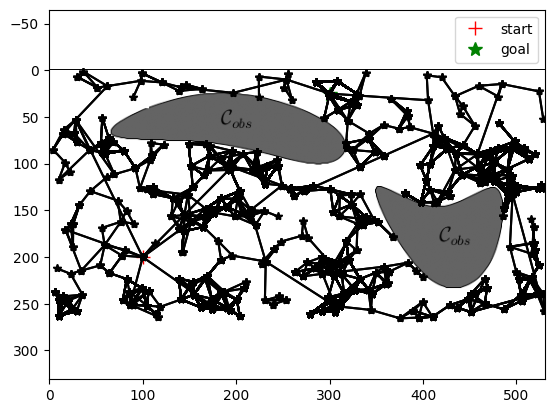
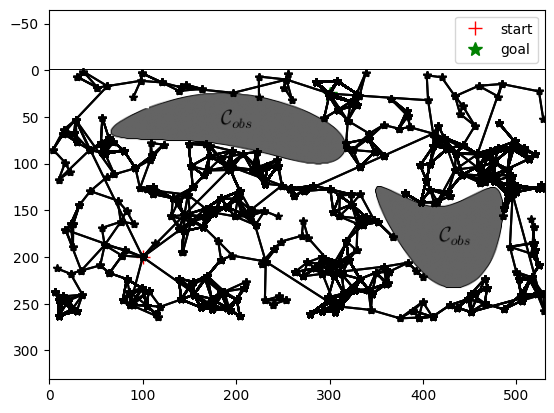
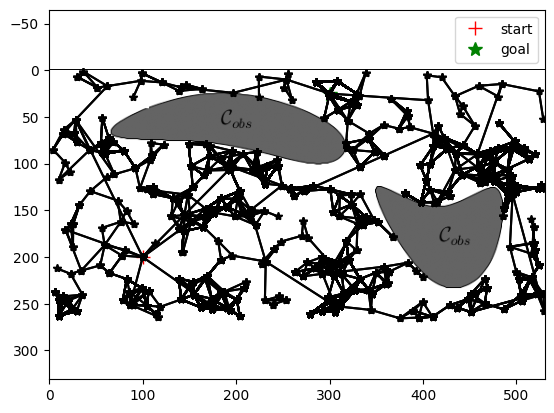
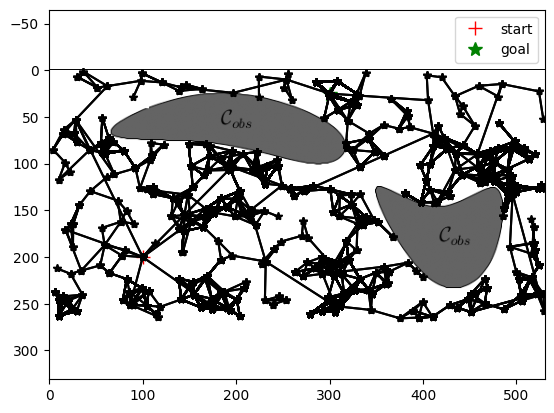
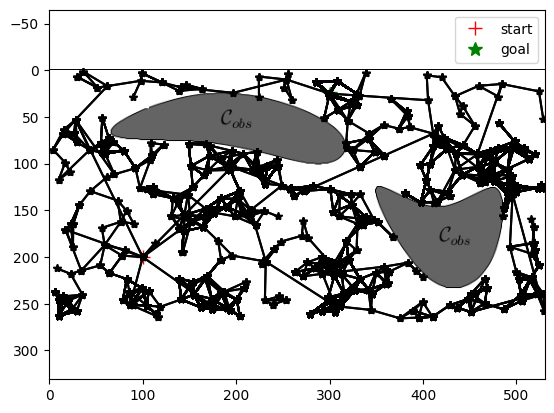
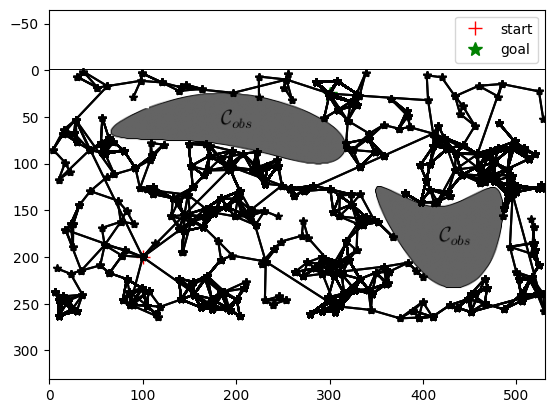
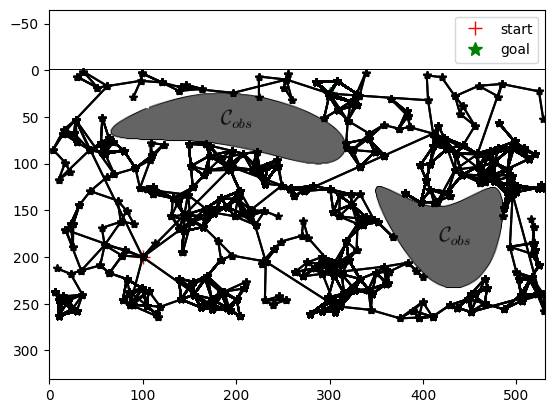
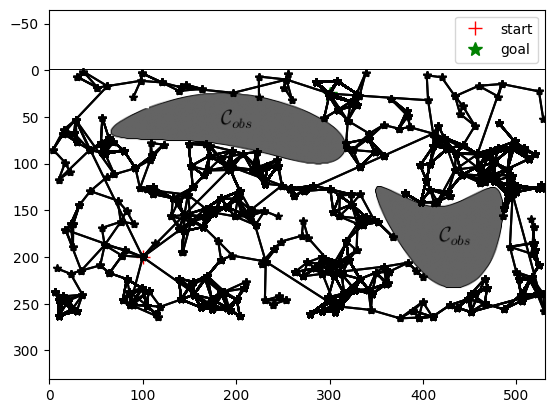
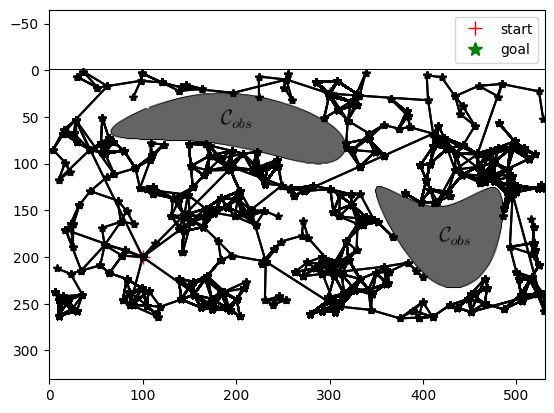
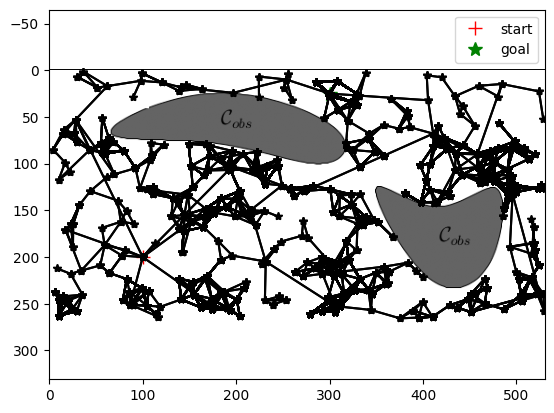
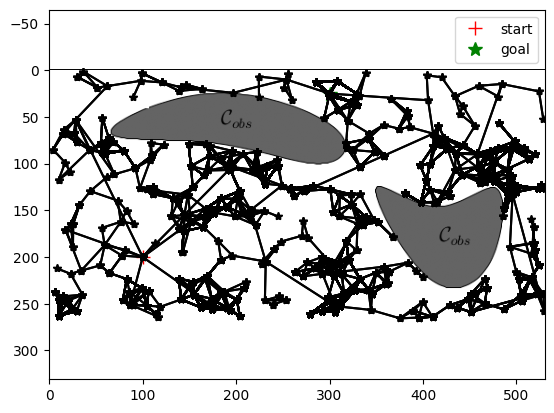
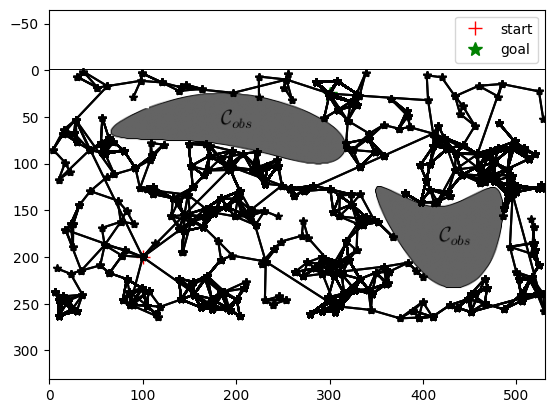
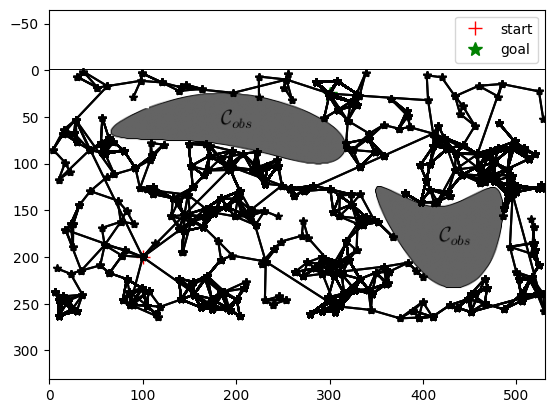
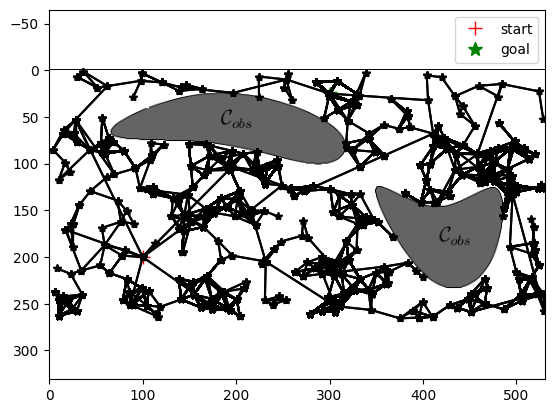
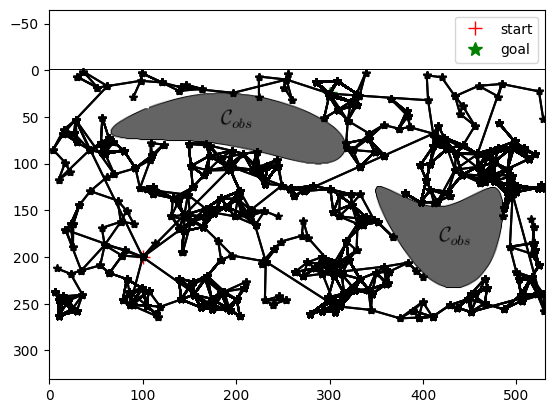
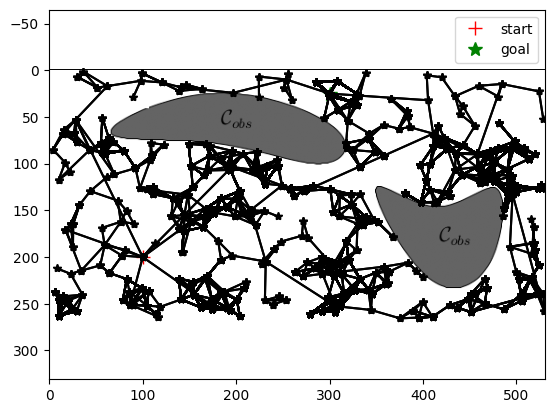
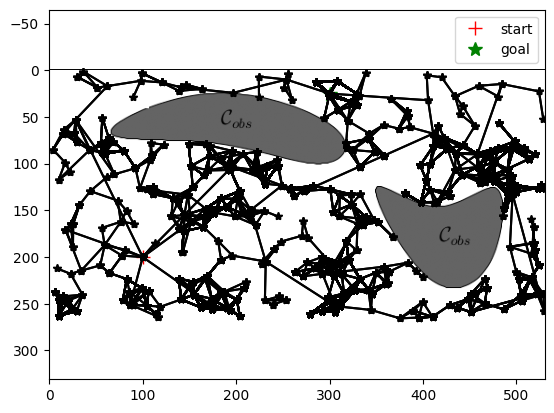
from astar import astar, backtrace_path
from functools import partial
import math

def euclidean_heurist_dist(node, goal, scale=1):
    x_n, y_n = node.coord
    x_g, y_g = goal.coord
    return scale*math.sqrt((x_n-x_g)**2 + (y_n - y_g)**2)


debugf=open('log.txt', 'w')
start_vert = graph.get_vertex(0)

success, search_path, node2parent, node2dist = astar(
    graph, partial(euclidean_heurist_dist, scale=1),
    start_vert, goal_vert, debug=True, debugf=debugf)
debugf.close()
#print(success, search_path)
assert success
#anim = maze.animate(search_path)
#anim.save(filename='astar-anim.gif', writer='pillow')
path = list(backtrace_path(node2parent, start_vert, goal_vert))
#maze.init_plots(reinit=True)
#print(path)
fig, ax = plt.subplots()
plot_map(ax, img, goal, start)
graph.plot(ax)
path_plot = graph.plot_path(ax, path, color='r') # Draws the traced shortest path
plt.savefig('prm-maze.pdf')