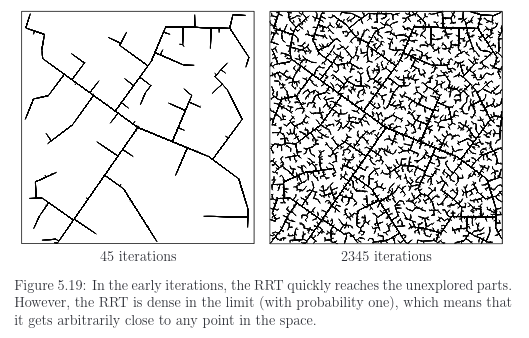
Rapidly exploring dense trees
Other variations of sampling based conversion of space into graph:
RRT-star (2) Probabilistic Road Maps (PRM)
Images from and required reading: Section 5.5 Of Lavalle
!pip install ipymplRequirement already satisfied: ipympl in /home/vdhiman/.local/venvs/ece490/lib/python3.10/site-packages (0.9.7)
Requirement already satisfied: ipython<10 in /home/vdhiman/.local/venvs/ece490/lib/python3.10/site-packages (from ipympl) (8.37.0)
Requirement already satisfied: ipywidgets<9,>=7.6.0 in /home/vdhiman/.local/venvs/ece490/lib/python3.10/site-packages (from ipympl) (8.1.7)
Requirement already satisfied: matplotlib<4,>=3.5.0 in /home/vdhiman/.local/venvs/ece490/lib/python3.10/site-packages (from ipympl) (3.10.6)
Requirement already satisfied: numpy in /home/vdhiman/.local/venvs/ece490/lib/python3.10/site-packages (from ipympl) (2.2.6)
Requirement already satisfied: pillow in /home/vdhiman/.local/venvs/ece490/lib/python3.10/site-packages (from ipympl) (11.3.0)
Requirement already satisfied: traitlets<6 in /home/vdhiman/.local/venvs/ece490/lib/python3.10/site-packages (from ipympl) (5.14.3)
Requirement already satisfied: decorator in /home/vdhiman/.local/venvs/ece490/lib/python3.10/site-packages (from ipython<10->ipympl) (5.2.1)
Requirement already satisfied: exceptiongroup in /home/vdhiman/.local/venvs/ece490/lib/python3.10/site-packages (from ipython<10->ipympl) (1.3.0)
Requirement already satisfied: jedi>=0.16 in /home/vdhiman/.local/venvs/ece490/lib/python3.10/site-packages (from ipython<10->ipympl) (0.19.2)
Requirement already satisfied: matplotlib-inline in /home/vdhiman/.local/venvs/ece490/lib/python3.10/site-packages (from ipython<10->ipympl) (0.1.7)
Requirement already satisfied: pexpect>4.3 in /home/vdhiman/.local/venvs/ece490/lib/python3.10/site-packages (from ipython<10->ipympl) (4.9.0)
Requirement already satisfied: prompt_toolkit<3.1.0,>=3.0.41 in /home/vdhiman/.local/venvs/ece490/lib/python3.10/site-packages (from ipython<10->ipympl) (3.0.52)
Requirement already satisfied: pygments>=2.4.0 in /home/vdhiman/.local/venvs/ece490/lib/python3.10/site-packages (from ipython<10->ipympl) (2.19.2)
Requirement already satisfied: stack_data in /home/vdhiman/.local/venvs/ece490/lib/python3.10/site-packages (from ipython<10->ipympl) (0.6.3)
Requirement already satisfied: typing_extensions>=4.6 in /home/vdhiman/.local/venvs/ece490/lib/python3.10/site-packages (from ipython<10->ipympl) (4.15.0)
Requirement already satisfied: comm>=0.1.3 in /home/vdhiman/.local/venvs/ece490/lib/python3.10/site-packages (from ipywidgets<9,>=7.6.0->ipympl) (0.2.3)
Requirement already satisfied: widgetsnbextension~=4.0.14 in /home/vdhiman/.local/venvs/ece490/lib/python3.10/site-packages (from ipywidgets<9,>=7.6.0->ipympl) (4.0.14)
Requirement already satisfied: jupyterlab_widgets~=3.0.15 in /home/vdhiman/.local/venvs/ece490/lib/python3.10/site-packages (from ipywidgets<9,>=7.6.0->ipympl) (3.0.15)
Requirement already satisfied: contourpy>=1.0.1 in /home/vdhiman/.local/venvs/ece490/lib/python3.10/site-packages (from matplotlib<4,>=3.5.0->ipympl) (1.3.2)
Requirement already satisfied: cycler>=0.10 in /home/vdhiman/.local/venvs/ece490/lib/python3.10/site-packages (from matplotlib<4,>=3.5.0->ipympl) (0.12.1)
Requirement already satisfied: fonttools>=4.22.0 in /home/vdhiman/.local/venvs/ece490/lib/python3.10/site-packages (from matplotlib<4,>=3.5.0->ipympl) (4.59.2)
Requirement already satisfied: kiwisolver>=1.3.1 in /home/vdhiman/.local/venvs/ece490/lib/python3.10/site-packages (from matplotlib<4,>=3.5.0->ipympl) (1.4.9)
Requirement already satisfied: packaging>=20.0 in /home/vdhiman/.local/venvs/ece490/lib/python3.10/site-packages (from matplotlib<4,>=3.5.0->ipympl) (25.0)
Requirement already satisfied: pyparsing>=2.3.1 in /home/vdhiman/.local/venvs/ece490/lib/python3.10/site-packages (from matplotlib<4,>=3.5.0->ipympl) (3.2.3)
Requirement already satisfied: python-dateutil>=2.7 in /home/vdhiman/.local/venvs/ece490/lib/python3.10/site-packages (from matplotlib<4,>=3.5.0->ipympl) (2.9.0.post0)
Requirement already satisfied: parso<0.9.0,>=0.8.4 in /home/vdhiman/.local/venvs/ece490/lib/python3.10/site-packages (from jedi>=0.16->ipython<10->ipympl) (0.8.5)
Requirement already satisfied: ptyprocess>=0.5 in /home/vdhiman/.local/venvs/ece490/lib/python3.10/site-packages (from pexpect>4.3->ipython<10->ipympl) (0.7.0)
Requirement already satisfied: wcwidth in /home/vdhiman/.local/venvs/ece490/lib/python3.10/site-packages (from prompt_toolkit<3.1.0,>=3.0.41->ipython<10->ipympl) (0.2.13)
Requirement already satisfied: six>=1.5 in /home/vdhiman/.local/venvs/ece490/lib/python3.10/site-packages (from python-dateutil>=2.7->matplotlib<4,>=3.5.0->ipympl) (1.17.0)
Requirement already satisfied: executing>=1.2.0 in /home/vdhiman/.local/venvs/ece490/lib/python3.10/site-packages (from stack_data->ipython<10->ipympl) (2.2.1)
Requirement already satisfied: asttokens>=2.1.0 in /home/vdhiman/.local/venvs/ece490/lib/python3.10/site-packages (from stack_data->ipython<10->ipympl) (3.0.0)
Requirement already satisfied: pure-eval in /home/vdhiman/.local/venvs/ece490/lib/python3.10/site-packages (from stack_data->ipython<10->ipympl) (0.2.3)
[notice] A new release of pip is available: 25.0.1 -> 25.2
[notice] To update, run: pip install --upgrade pip
import urllib
import os
def ensuredirs(path):
    os.makedirs(os.path.dirname(path), exist_ok=True)
    return path
wget = urllib.request.urlretrieve
url = 'https://vikasdhiman.info/ECE498-Mobile-Robots/notebooks/01-1901-discrete-planning/imgs/RRT-map.png'
filename = 'imgs/RRT-map.png'
wget(url, filename=ensuredirs(filename))
('imgs/RRT-map.png', <http.client.HTTPMessage at 0x74e296f333a0>)%matplotlib inline
import numpy as np
import random
# random.seed(1004)
# np.random.seed(1004)
from PIL import Image
import matplotlib.pyplot as plt
# I removed the graph lines from the map above using photoshop and
# saved only the obstacles. Load that map as a png file.
# It is color image; convert it to grayscale.
img_gray = Image.open("imgs/RRT-map.png").convert('L')
# convert the image to a numpy array
img = np.asarray(img_gray)
fig, ax = plt.subplots()
ax.imshow(img, cmap='gray') # plot the image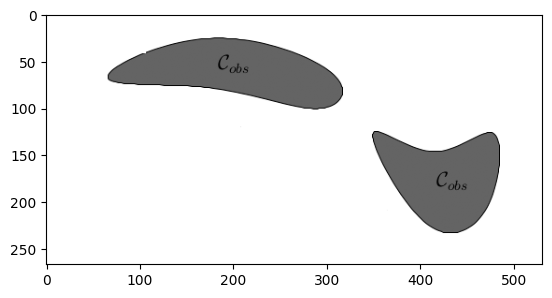
%matplotlib inline
# Pick some arbitray start and goal points
goal = (300., 25.)
start = (100., 200.)
fig, ax = plt.subplots()
ax.imshow(img, cmap='gray') # Plot the image again
ax.plot(start[0], start[1], 'r+', markersize=10, label='start')
ax.plot(goal[0], goal[1], 'g*', markersize=10, label='goal')
ax.legend()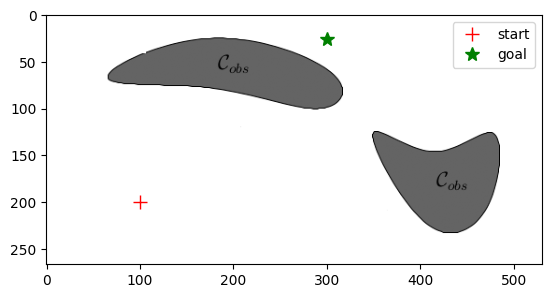
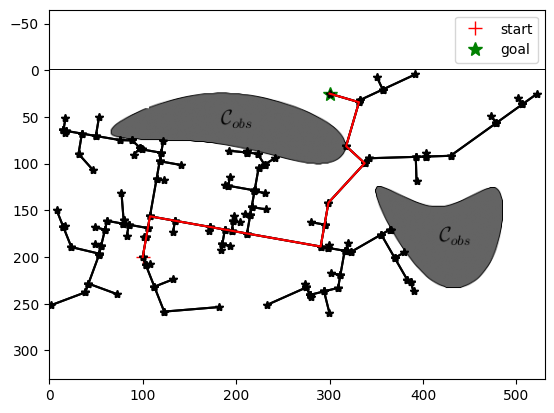
We have a problem to solve
We want to find the shortest path from start to goal in the continuous domain while avoiding obstacles.
Rapidly exploring random trees
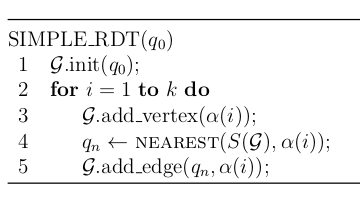
The main idea of the algorithm is:
Initialize an empty graph with the start point
While not done:
a. Sample points on the chosen area. If the point is obstacle area, continue to the next iteration.
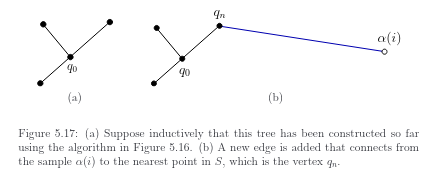
b. Connect the sampled point to the nearest point (vertex or edge) on the graph, as long as the connecting line does not pass through the obstacle.
from dataclasses import dataclass
# Need img as the map representation
assert img is not None

@dataclass
class Vertex:
    """
    Class to encode a graph vertex with a unique idx : a number
    and its coordinates as a numpy array.
    """
    idx: int
    coord: np.ndarray

    # Make the PItem hashable
    # https://docs.python.org/3/glossary.html#term-hashable
    def __hash__(self):
        return self.idx

    def __eq__(self, other):
        return self.idx == other.idx

class Graph:
    """
    Keeps track of nodes and their 2D coordinates.
    The datastructure of choice here is an adjacency list.
    """
    def __init__(self):
        self.adjacency_list = {}
        self.vertex_list = []

    @classmethod
    def from_adjacency_matrix(cls, vertex_coords, G_adjacency_matrix):
        """
        Generate the graph from an adjacency matrix and vertex coordinates
        """
        self = cls()
        self.vertex_coordinates = vertex_coords
        for vi, v in enumerate(vertex_coords):
            vert = Vertex(idx=vi, coord=v)
            self.vertex_list.append(vert)
            self.adjacency_list[vert] = [
                Vertex(idx=pnj, coord=pn)
                for pnj, pn in enumerate(vertex_coords)
                if (G_adjacency_matrix[vi, pnj])]
        return self

    def get(self, v, default=[]):
        """
        Interface with path planning algorithms like astar using
        .get function.

        This function returns a list of neighbors along with
        edge-cost which is the euclidean distance between the
        coordinates of this ndoe and the neighbors.
        """
        vcoord = np.array(v.coord)
        return [(nbr, np.linalg.norm(vcoord-nbr.coord))
                for nbr in self.adjacency_list[v]]

    def add_vertex(self, coordinate):
        """
        Add new vertex to the graph. Assume it does not exists.
        """
        idx = len(self.vertex_list)
        vert = Vertex(idx=idx, coord=coordinate)
        self.adjacency_list[vert] = []
        self.vertex_list.append(vert)
        return vert

    def add_edge_directed(self, vi : Vertex, vj : Vertex):
        """
        Add a new edge to the graph from vi -> vj
        """
        assert isinstance(vi, Vertex)
        assert isinstance(vj, Vertex)
        self.adjacency_list.setdefault(vi, []).append(vj)

    def add_edge(self, vi, vj, undirected=True):
        """
        Add an undirected or directed edge to the graph.
        """
        self.add_edge_directed(vi, vj)
        if undirected:
            self.add_edge_directed(vj, vi)

    def remove_edge_directed(self, vi, vj):
        vjidx = self.adjacency_list[vi].index(vj)
        del self.adjacency_list[vi][vjidx]

    def remove_edge(self, vi, vj, undirected=True):
        self.remove_edge_directed(vi, vj)
        if undirected:
            self.remove_edge_directed(vj, vi)

    def vertices(self):
        """
        Return all vertices
        """
        return self.vertex_list

    def get_vertex(self, idx):
        """
        Get a perticular Vertex object by Vertex.idx
        """
        return self.vertex_list[idx]

    def vertex_coords(self):
        """
        Return the vertex coordinates as a numpy array
        """
        return np.asarray([vert.coord
                           for vert in self.vertex_list])

    def vertices_no_nbrs(self):
        """
        Return isolated vertices that do not have any
        neighbors.
        """
        return [vid for vid, nbrsid in self.adjacency_list.items()
                if not len(nbrsid)]

    def edges_coords(self):
        """
        Return edge_ids and edge_coords as lists where

        edge_ids = [(v1s.idx, v1e.idx),
                     (v2s.idx, v2e.idx), ...]
        edge_coords = [(v1s.coord, v2e.coord),
                        (v2s.coord, v2e.coord), ...]

        edge_ids contain the vertex indices as start and end pairs
        edge_coords contain the vertex coordinates for each edge with
        start and end pairs.
        """
        edge_ids = []
        edge_list = []
        for vid, nbrsid in self.adjacency_list.items():
            for nid in nbrsid:
                edge_ids.append((vid.idx, nid.idx))
                edge_list.append((vid.coord, nid.coord))
        return edge_ids, edge_list

    def plot(self, ax : plt.Axes, vertexids=False, marker='k*-'):
        """
        Plot the graph on the matplotlib axes object
        """
        ax.axis('equal')
        edge_ids, edge_coords = self.edges_coords()
        for (vid, nid), (v, n) in zip(edge_ids, edge_coords):
            ax.plot([v[0], n[0]], [v[1], n[1]], marker)
            if vertexids:
                ax.text(v[0], v[1], str(vid))
                ax.text(n[0], n[1], str(nid))

    def plot_path(self, ax : plt.Axes, path, color='r'):
        """
        Plat the path on the matplotlib axes
        """
        xs = []
        ys = []
        for vert in path:
            xs.append(vert.coord[0])
            ys.append(vert.coord[1])
        ax.plot(xs, ys, '-', color=color)

# 1. Initialize an empty graph with the start point
G_adjacency_list = Graph()
G_adjacency_list.add_vertex(start)

Npts = 1 # we are going to sample 100 points, but start with 1 point
pt_min, pt_max = np.array([0, 0]), np.array([img.shape[1], img.shape[0]])
# 2. While not done:
for i in range(Npts):
    # 2.a Sample points on the chosen area.
    # If the point is obstacle area, continue to the next iteration.
    random_pt = np.random.rand(2) * (pt_max - pt_min) + pt_min

random_pt
array([ 41.2443795 , 134.23533454])%matplotlib inline
# Let's plot this point
def plot_map(ax, img, goal, start):
ax.imshow(img, cmap='gray') # Plot the image again
ax.plot(start[0], start[1], 'r+', markersize=10, label='start')
ax.plot(goal[0], goal[1], 'g*', markersize=10, label='goal')
ax.legend()
return ax
fig, ax = plt.subplots()
plot_map(ax, img, goal, start)
picked_pt, = ax.plot(random_pt[0], random_pt[1], 'bo', markersize=2, label='picked')
ax.legend()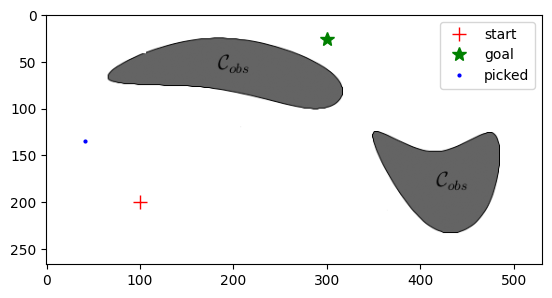
# check the color of image at the random_pt
# Note that I have used y-coordinate for rows and
# x-coordinate for cols
random_pt_int = np.round(random_pt).astype(dtype=np.int64)
img[random_pt_int[1], random_pt_int[0]]np.uint8(255)Distinguishing obstacles from free area
We will find the color values inside the gray obstacles and in the white area. The following code creates an interactive widget that you can click on to find the color of the pixel at the clicked point.
# Click anywere on the gray area in the image to find the color of that point
import ipywidgets as widgets # Make the print statement interactive
# Make the matplotlib figure interactive
%matplotlib widget

# Draw the map
fig, ax = plt.subplots()
plot_map(ax, img, goal, start)
picked_pt, = ax.plot(random_pt[0], random_pt[1], 'bo', markersize=2, label='picked')
ax.legend()

# Create a textarea to display the interactive message
txtwidget = widgets.Textarea(
    value='You have not clicked on the figure yet',
    placeholder='You have not clicked on the figure yet',
    description='Color:  ',
    disabled=True,
    width=200
)
display(txtwidget)

# This function will be called whenever you click anywhere on the map
def onclick(event):
    x, y = event.xdata, event.ydata
    picked_pt.set_xdata([x])
    picked_pt.set_ydata([y])
    # Change the display message in the figure
    txtwidget.value = "%d" % (img[int(y), int(x)])

fig.canvas.mpl_connect('button_release_event', onclick)15Note that the gray areas have color value 100 while the white areas have color 255. We will treat 200 as threshold. Any color value smaller than 200 will be considered as an obstacle. Image boundaries are also an obstacle. The robot cannot go through gray areas or outside the image.
# 100 is darker than 255.
# Our collision check is checking for the color.
# I pick the threshold between 100 and 255 arbitrarily as
# 200
def do_points_collide(img, pts):
    """
    Returns true or false per point,

    If the point is out of the image on
    """
    # threshold between white (255) and gray (100) color
    threshold = 200 # chose the threshold as 200
    pts = np.round(pts).astype(dtype=np.int64) # convert the points to integers

    # Test if the points are inside the iamge or not
    # We are using numpy boolean operators
    # https://numpy.org/doc/stable/reference/generated/numpy.logical_and.html
    in_img = (
        (0 <= pts) # pts is a N x 2 => N x 2 array of booleans
        &
        (pts < np.array((img.shape[1], img.shape[0]))) # N x 2 array of booleans
    ).all(axis=-1) # True if and only if all the elements of the boolean array along axis is True
    out_of_img = ~in_img # Numpy not operator, N

    # Convert all the out of image points in image so that we can use them to index
    # in img
    in_img_pts = pts.copy() # N x 2
    # it does not matter what the value is as long as it is inside the img bounds
    in_img_pts[out_of_img, :] = 0  # Boolean indexing: only the parts of array where indexing array is true are selected

    # Index the image using pts. Y-coordinate is the row and X-coordinate is the column
    colors_per_pt = img[in_img_pts[..., 1], in_img_pts[..., 0]]
    # The points collide if they are out of the image or below the grayness threshold
    return (out_of_img) | (colors_per_pt < threshold)

def does_point_collide(img, pt):
    return do_points_collide(img, pt)

# Lets check our function again
# For a collision free point
assert does_point_collide(img, np.array([20.68332004, 228.68439464])) == False
# For a collision point
assert does_point_collide(img, np.array([200., 50.])) == True
We are going to go back to our incomplete algorithm and add collision check
Broadcasting is a numpy/pytorch/Tensorflow/jax feature
If you are operating on (for eexample, add, mul, sub, matmul, div) two inputs, A, B
you check A.shape and B.shape from right to left.
The operation is valid if (a) either the corresponding dim are equal or (b) one of them is 1.
The result of the operation is of size with each dimension that is bigger.
A.shape = (4, 5, 4, 1, 2) B.shape = (1, 4, 3, 1)
C = A * B
C.shape = (4, 5, 4, 3, 2)
import numpy as np
A = np.random.rand(100, 2, 3)
b = np.random.rand(100, 3)
C = A @ b[:, :, None]
# C.shape = (2,)
A.shape, b.shape, C.shape
((100, 2, 3), (100, 3), (100, 2, 1))# Need img as the map representation
assert img is not None
# 1. Initialize an empty graph with the start point
G_adjacency_list = Graph()
G_adjacency_list.add_vertex(start)
Npts = 1 # we are going to sample 100 points, but start with 1 point
# Specify the bounds of the map
pt_min = np.array([0, 0])
pt_max = np.array([img.shape[1], img.shape[0]])
# 2. While not done
for i in range(Npts):
# 2.a Sample points on the chosen area.
random_pt = np.random.rand(2) * (pt_max - pt_min) + pt_min
# If the point is obstacle area, continue to the next iteration.
if does_point_collide(img, random_pt):
continue
# 2.B Connect the sampled point to the nearest point (vertex or edge)
# on the graph, as long as the connecting line does not pass through the obstacle.
Finding the nearest vertex or edge on graph
There are faster algorithms to do this where we can maintain a k-d tree and lookup the nearest vertex in time.
However, we are going to go with brute force approach and loop over all the vertices to find the closest vertex, which is .
vertices_np = G_adjacency_list.vertex_coords() # np.array of size N x 2
diff_vec = (vertices_np - random_pt) # np.array of size N x 2
dists_per_vec = np.sqrt((diff_vec**2).sum(axis=-1)) # np.array of size N
closest_vertex = vertices_np[np.argmin(dists_per_vec)] # np.array of size 2
closest_vertex
array([100., 200.])Let’s make the above code a function and stress test it a bit.
def find_nearest_vertex(G_adjacency_list, pt):
    """
    Find the nearest vertex to the point pt in the graph G_adjacency_list.
    """
    vertices_np = G_adjacency_list.vertex_coords() # np.array of size N x 2
    diff_vec = (vertices_np - pt) # np.array of size N x 2 # example of something called broadcasting
    dists_per_vec = np.sqrt((diff_vec**2).sum(axis=-1)) # np.array of size N
    closest_vertex = vertices_np[np.argmin(dists_per_vec)] # np.array of size 2
    return closest_vertex
# Create a random graph to stress test the function
def generate_random_graph(nvertices=10, # How many vertices
# Fraction of vertices connected to each other
# 1 means fully connected
# 0 means none connected
edge_density=0.2,
selfedges=False, # allow self edges
undirected=True, # is the graph undirected
pt_min=np.array([0., 0.]), # range of points
pt_max=np.array([1., 1.])):
"""
Generate a random graph with given
"""
D = pt_min.shape[0] # dimensions
vertices = np.random.rand(nvertices, D) * (pt_max - pt_min) + pt_min
G_adjacency_matrix_samples = np.random.rand(
nvertices, nvertices)
if undirected:
matrix_edge_density = edge_density / 2
G_adjacency_matrix_samples = np.tril(G_adjacency_matrix_samples, k=1)
G_adjacency_matrix_samples += G_adjacency_matrix_samples.T
G_adjacency_matrix_samples /= 2.
# Pick the edge if the uniformly sampled prob is below edge_density
G_adjacency_matrix = G_adjacency_matrix_samples < matrix_edge_density
if not selfedges:
np.fill_diagonal(G_adjacency_matrix, 0)
G_adjacency_list = Graph.from_adjacency_matrix(vertices.tolist(), G_adjacency_matrix)
return G_adjacency_list
generate_random_graph()<__main__.Graph at 0x74e26c1af640>%matplotlib inline
fig, ax = plt.subplots()
graph = generate_random_graph()
graph.plot(ax)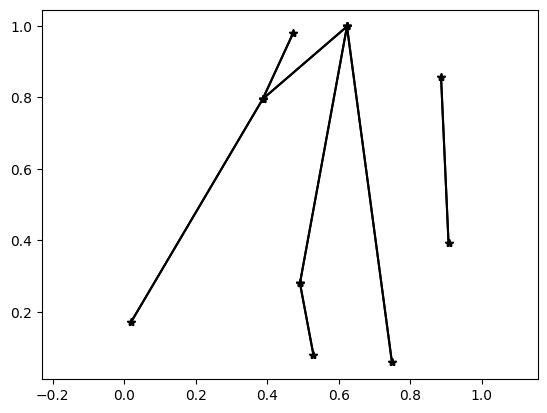
Let’s pick a test point near different nodes by clicking on the figure and test the find_nearest_vertex function.
%matplotlib widget
fig, ax = plt.subplots()
graph = generate_random_graph()
graph.plot(ax)
picked_pt = np.random.rand(2)
nearest_pt = find_nearest_vertex(graph, picked_pt)
pickedline, = ax.plot(picked_pt[0], picked_pt[1], 'r+', label='Picked')
nearestline, = ax.plot(nearest_pt[0], nearest_pt[1], 'go', markersize=8, label='Nearest')
ax.legend()

# useful for debuging
# # Create a textarea to display the interactive message
# txtwidget = widgets.Textarea(
#     value='Picked: (000.0, 000.0); Nearest: (000.0, 000.0)',
#     placeholder='Picked: (000.0, 000.0); Nearest: (000.0, 000.0)',
#     description='',
#     disabled=True
# )
# display(txtwidget)

def onclick_nearest(event):
    pickedline.set_xdata([event.xdata])
    pickedline.set_ydata([event.ydata])

    nearest_pt = find_nearest_vertex(graph, np.array([event.xdata, event.ydata]))
    nearestline.set_xdata(nearest_pt[:1])
    nearestline.set_ydata(nearest_pt[1:])
    # txtwidget.value = f'Picked: ({event.xdata:0.3f}, {event.ydata:0.3f}); Nearest: {nearest_pt}'

fig.canvas.mpl_connect('button_release_event', onclick_nearest)
15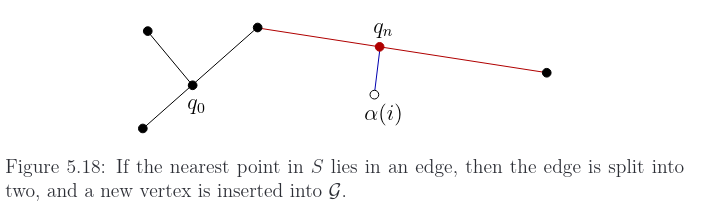
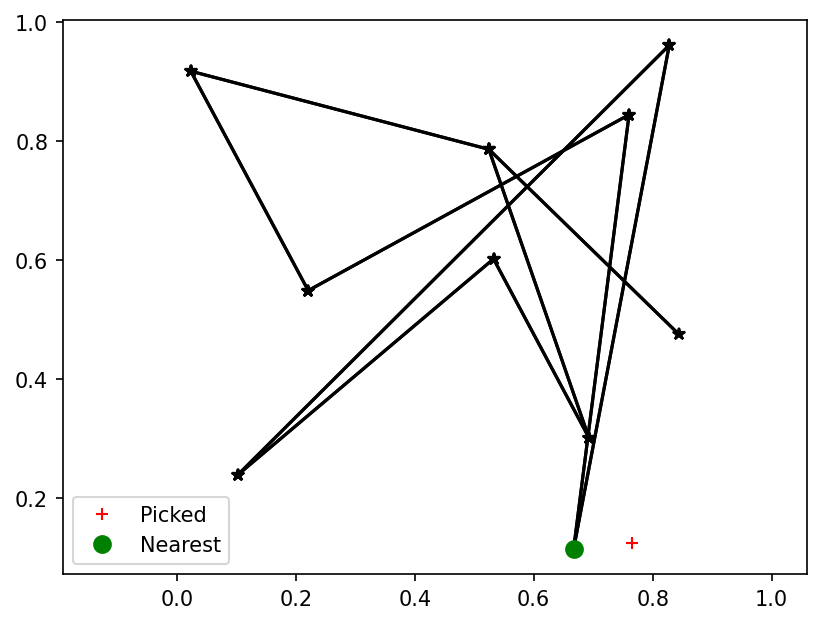
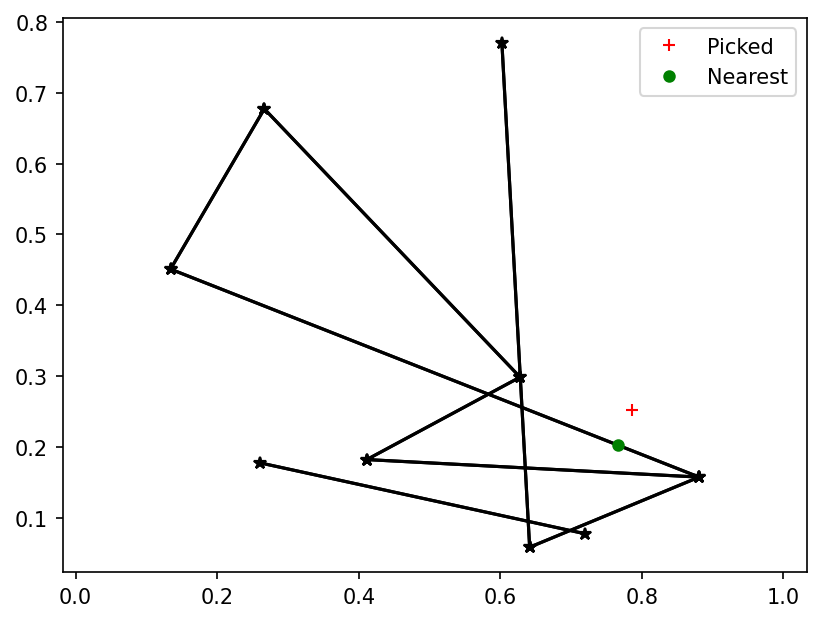
Finding nearest point on edges
What if the nearest point lies on an edge rather than a vertex?
To compute this we need to find a formula for nearest point to a line. Consider a point and an edge where is the start vertex and is the end vertex for the edge. Find the shortest distance to the edge.
Representation of a line passsing through two points. Let be a free parameter. Then the line passinging through and is a set of all points
Moreover, if then the line point lies between the two end points and . If , then the point lies before and if then it lies after .
The shortest distance between a point and a line is along the perpendicular to the line that passes through . Let be such a point where the perpendicular from meets the line . Then we have,
This is one equation to solve for one variable ,
def closest_point_on_line_segs(edges, x):
    """
    Find the closest point to x on all the edges
    """
    assert edges.shape[-2] == 2
    *N, _, D = edges.shape
    vs, ve = edges[:, 0, :], edges[:, 1, :]
    # edge_vec = ve - vs # *N x D
    # edge_mag = np.linalg.norm(edge_vec, axis=-1, keepdims=True) #  *N
    # edge_unit = edge_vec / edge_mag # *N x D

    # closest pt on edge = l(t) = vs + t * (ve - vs)
    # t = (x - vs) @ (ve - vs) / ||ve - vs||^2
    edge_vec = (ve - vs)
    edge_vec_mag_sq = (edge_vec * edge_vec).sum(axis=-1, keepdims=True) # N x 1
    t = ((x - vs) * edge_vec).sum(axis=-1, keepdims=True) / edge_vec_mag_sq # N x 1

    # l(t) = vs + t * (ve - vs)
    lt = vs + t * edge_vec # *N x D

    # Perpendicular distance from the edge
    dist_e = np.linalg.norm(x - lt, axis=-1)

    # Distance from the end vertices
    dist_vs = np.linalg.norm(x - vs, axis=-1)
    dist_ve = np.linalg.norm(x - ve, axis=-1)
    # The minimum of the two is the closer one
    dist_v = np.minimum(dist_vs, dist_ve)

    # Is the point inside the edge?
    is_pt_inside_edge = ((0 <= t) & (t <= 1))[..., 0]


    # Take the edge distance only if the perpendicular falls
    # within the edge bounds otherwise take the minimumm
    # of the vertex distance
    dist = np.where(is_pt_inside_edge,
                    dist_e,
                    dist_v)
    min_idx = np.argmin(dist)
    closest_point, point_type =  (
        (lt[min_idx], slice(0, 2)) if is_pt_inside_edge[min_idx]
        else (vs[min_idx], slice(0, 1)) if (dist_vs[min_idx] < dist_ve[min_idx])
        else (ve[min_idx], slice(1, 2))
    )
    return closest_point, dist[min_idx], (min_idx, point_type)
%matplotlib widget
fig, ax = plt.subplots()
graph = generate_random_graph()
graph.plot(ax)
picked_pt = np.random.rand(2)
nearest_pt, _, _ = closest_point_on_line_segs(np.asarray(graph.edges_coords()[1]), picked_pt)
pickedline, = ax.plot(picked_pt[0], picked_pt[1], 'r+', label='Picked')
nearestlines, = ax.plot(nearest_pt[0], nearest_pt[1], 'go', markersize=5, label='Nearest')
ax.legend()
# # useful for debuging
# # Create a textarea to display the interactive message
# txtwidget = widgets.Textarea(
# value='Picked: (000.0, 000.0); Nearest: (000.0, 000.0)',
# placeholder='Picked: (000.0, 000.0); Nearest: (000.0, 000.0)',
# description='',
# disabled=True
# )
# display(txtwidget)
def onclick_nearest(event):
pickedline.set_xdata([event.xdata])
pickedline.set_ydata([event.ydata])
picked_pt = np.array([event.xdata, event.ydata])
nearest_pt, _, _ = closest_point_on_line_segs(np.asarray(graph.edges_coords()[1]), picked_pt)
# txtwidget.value = str(nearest_pt)
nearestlines.set_xdata([nearest_pt[0]])
nearestlines.set_ydata([nearest_pt[1]])
fig.canvas.mpl_connect('button_release_event', onclick_nearest)
15def points_within_circle(edges, x, radius=None):
"""
Find all the edges that lie within a given radius of a point x
"""
assert edges.shape[-2] == 2
*N, _, D = edges.shape
vs, ve = edges[:, 0, :], edges[:, 1, :]
# edge_vec = ve - vs # *N x D
# edge_mag = np.linalg.norm(edge_vec, axis=-1, keepdims=True) # *N
# edge_unit = edge_vec / edge_mag # *N x D
# closest pt on edge = l(t) = vs + t * (ve - vs)
# t = (x - vs) @ (ve - vs) / ||ve - vs||^2
edge_vec = (ve - vs)
edge_vec_mag_sq = (edge_vec * edge_vec).sum(axis=-1, keepdims=True) # N x 1
t = ((x - vs) * edge_vec).sum(axis=-1, keepdims=True) / edge_vec_mag_sq # N x 1
# l(t) = vs + t * (ve - vs)
lt = vs + t * edge_vec # *N x D
# Perpendicular distance from the edge
dist_e = np.linalg.norm(x - lt, axis=-1)
# Distance from the end vertices
dist_vs = np.linalg.norm(x - vs, axis=-1)
dist_ve = np.linalg.norm(x - ve, axis=-1)
# The minimum of the two is the closer one
dist_v = np.minimum(dist_vs, dist_ve)
# Is the point inside the edge?
is_pt_inside_edge = ((0 <= t) & (t <= 1))[..., 0]
# Take the edge distance only if the perpendicular falls
# within the edge bounds otherwise take the minimumm
# of the vertex distance
dist = np.where(is_pt_inside_edge,
dist_e,
dist_v)
closest_points = np.where(is_pt_inside_edge,
lt,
np.where(dist_vs < dist_ve,
vs, ve))
point_type = np.where(is_pt_inside_edge,
slice(0, 2),
np.where(dist_vs < dist_ve,
slice(0, 1),
slice(1, 2)))
if radius is None:
radius = np.min(dist)
within_radius = dist < radius # a boolean per edge
dists_within_radius = dist[within_radius]
closest_points_within_radius = closest_points[within_radius]
indices_within_radius = np.arange(len(dist))[within_radius]
point_types_within_radius = point_type[within_radius]
return closest_points_within_radius, dists_within_radius, (indices_within_radius, point_types_within_radius)
def closest_point_on_graph(graph, pt):
    assert len(graph.vertices())
    edge_ids, edge_list = map(np.asarray, graph.edges_coords())
    if len(edge_list):
        closest_point_e, min_dist_e, min_idx_pt_type = closest_point_on_line_segs(edge_list, pt)
        min_idx_e, pt_type = min_idx_pt_type
        vids = edge_ids[min_idx_e, pt_type]
        vertices = ((graph.get_vertex(vids[0]), graph.get_vertex(vids[1]))
                    if len(vids) == 2
                    else
                    (graph.get_vertex(vids[0]),))
    else:
        min_dist_e = np.inf

    vertices_no_nbrs = graph.vertices_no_nbrs()
    if len(vertices_no_nbrs):
        verticesnp = np.array([vid.coord for vid in vertices_no_nbrs])
        dists_v = np.linalg.norm(verticesnp - pt, axis=-1)
        min_idx_v = np.argmin(dists_v)
        closest_point_v = verticesnp[min_idx_v]
        min_dist_v = dists_v[min_idx_v]
    else:
        min_dist_v  = np.inf

    return ((closest_point_v, min_dist_v, (vertices_no_nbrs[min_idx_v],))
                if  min_dist_v < min_dist_e
                else (closest_point_e, min_dist_e, vertices))
%matplotlib widget
fig, ax = plt.subplots()
graph = generate_random_graph()
graph.plot(ax)
picked_pt =  np.random.rand(2)
nearest_pt, _, _ = closest_point_on_graph(graph, picked_pt)
pickedline, = ax.plot(picked_pt[0], picked_pt[1], 'r+', label='Picked')
nearestlines, = ax.plot(nearest_pt[0], nearest_pt[1], 'go', markersize=5, label='Nearest')
ax.legend()

# # useful for debuging
# # Create a textarea to display the interactive message
# txtwidget = widgets.Textarea(
#     value='Picked: (000.0, 000.0); Nearest: (000.0, 000.0)',
#     placeholder='Picked: (000.0, 000.0); Nearest: (000.0, 000.0)',
#     description='',
#     disabled=True
# )
# display(txtwidget)

def onclick_nearest(event):
    pickedline.set_xdata([event.xdata])
    pickedline.set_ydata([event.ydata])
    picked_pt = np.array([event.xdata, event.ydata])
    nearest_pt, _, _ = closest_point_on_graph(graph, picked_pt)
    # txtwidget.value = str(nearest_pt)
    nearestlines.set_xdata([nearest_pt[0]])
    nearestlines.set_ydata([nearest_pt[1]])

fig.canvas.mpl_connect('button_release_event', onclick_nearest)
15
def expand_graph(graph, pt, nearest_pt, nearest_pt_verts):
    if len(nearest_pt_verts) == 2: # Nearest point is on the edge
        vs, ve = nearest_pt_verts
        graph.remove_edge(vs, ve)
        npt_vert = graph.add_vertex(nearest_pt)
        #print(npt_vert.coord)
        graph.add_edge(vs, npt_vert)
        graph.add_edge(npt_vert, ve)
    elif len(nearest_pt_verts) == 1:
        npt_vert = nearest_pt_verts[0]
    else:
        raise ValueError("Invalid nearest_pt_vids")

    fid = graph.add_vertex(pt)
    #print(fid.coord)
    graph.add_edge(npt_vert, fid)
    return fid
%matplotlib inline
fig, ax = plt.subplots()
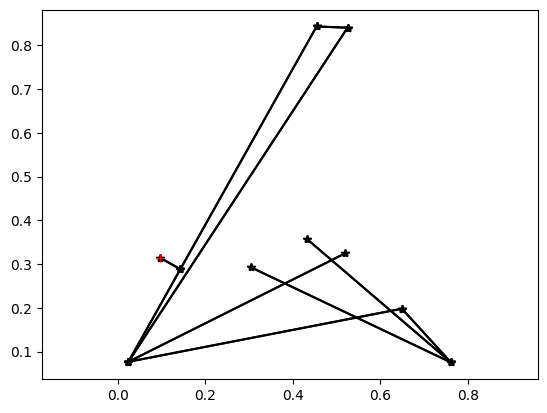
graph = generate_random_graph()
graph.plot(ax)
fig, ax = plt.subplots()
picked_pt = np.random.rand(2)
nearest_pt, dist, nearest_pt_verts = closest_point_on_graph(graph, picked_pt)
expand_graph(graph, picked_pt, nearest_pt, nearest_pt_verts)
graph.plot(ax)
pickedline, = ax.plot(picked_pt[0], picked_pt[1], 'r+', label='Picked')
%matplotlib widget
fig, ax = plt.subplots()
graph = generate_random_graph()
graph.plot(ax)

def onclick_nearest(event):
    picked_pt = np.array([event.xdata, event.ydata])
    nearest_pt, dist, nearest_pt_verts = closest_point_on_graph(graph, picked_pt)
    expand_graph(graph, picked_pt, nearest_pt, nearest_pt_verts)
    ax.clear()
    graph.plot(ax)
    pickedline, = ax.plot(picked_pt[0], picked_pt[1], 'r+', label='Picked')
    ax.legend()

fig.canvas.mpl_connect('button_release_event', onclick_nearest)15def does_edge_collide(graph, random_pt, nearest_pt, stepsize):
steps = int(np.floor(dist / stepsize))
if steps <= 0:
return True, None
direction = (random_pt - nearest_pt) / np.linalg.norm(random_pt - nearest_pt)
all_points = np.arange(1, steps + 1)[:, None]*stepsize*direction+ nearest_pt[None, :]
collisions = do_points_collide(img, all_points)
if collisions[0]:
return True, None
indices, = np.nonzero(collisions)
first_non_colliding = all_points[indices[0]-1] if len(indices) else random_pt
return False, first_non_colliding
%matplotlib inline
# Need img as the map representation
assert img is not None

np.random.seed(41)
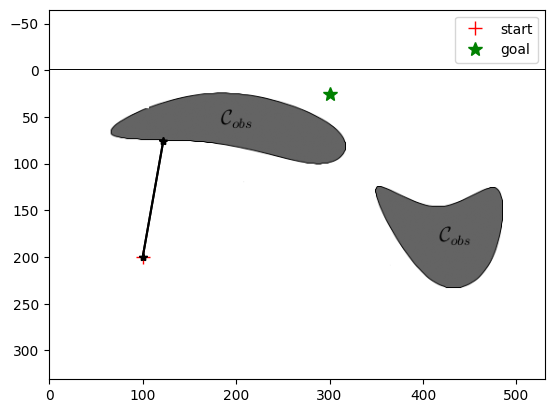
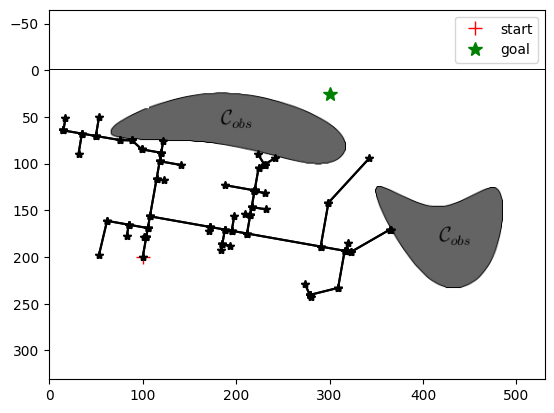
Npts = 100 # we are going to sample 100 points, but start with 1 point
# Specify the bounds of the map
pt_min = np.array([0, 0])
pt_max = np.array([img.shape[1], img.shape[0]])

stepsize = 1


# 1. Initialize an empty graph with the start point
graph = Graph()
graph.add_vertex(start)

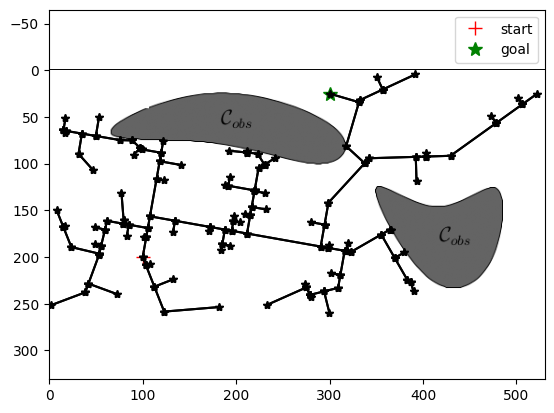
# 2. While not done
for i in range(Npts):
    # 2.a Sample points on the chosen area.
    random_pt = np.random.rand(2) * (pt_max - pt_min) + pt_min
    nearest_pt, dist, nearest_pt_vids = closest_point_on_graph(graph, random_pt)

    # 2.B Connect the sampled point to the nearest point (vertex or edge)
    # on the graph, as long as the connecting line does not pass through the obstacle.
    collision, first_non_colliding = does_edge_collide(graph, random_pt, nearest_pt, stepsize)
    if collision:
        continue
    expand_graph(graph, first_non_colliding, nearest_pt, nearest_pt_vids)

    if i % 50 == 0:
        fig, ax = plt.subplots()
        plot_map(ax, img, goal, start)
        graph.plot(ax)
        plt.show()


# 2.a Sample points on the chosen area.
random_pt = goal

nearest_pt, dist, nearest_pt_vids = closest_point_on_graph(graph, random_pt)

# 2.B Connect the sampled point to the nearest point (vertex or edge)
# on the graph, as long as the connecting line does not pass through the obstacle.
collision, first_non_colliding = does_edge_collide(graph, random_pt, nearest_pt, stepsize)
assert collision is False
goal_vert = expand_graph(graph, first_non_colliding, nearest_pt, nearest_pt_vids)

fig, ax = plt.subplots()
plot_map(ax, img, goal, start)
graph.plot(ax)
plt.show()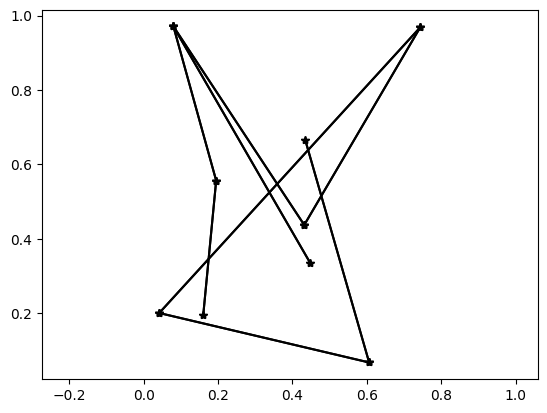
from astar import astar, backtrace_path
from functools import partial
import math

def euclidean_heurist_dist(node, goal, scale=1):
    x_n, y_n = node.coord
    x_g, y_g = goal.coord
    return scale*math.sqrt((x_n-x_g)**2 + (y_n - y_g)**2)


debugf=open('log.txt', 'w')
start_vert = graph.get_vertex(0)

success, search_path, node2parent, node2dist = astar(
    graph, partial(euclidean_heurist_dist, scale=1),
    start_vert, goal_vert, debug=True, debugf=debugf)
debugf.close()
#print(success, search_path)
assert success
#anim = maze.animate(search_path)
#anim.save(filename='astar-anim.gif', writer='pillow')
path = list(backtrace_path(node2parent, start_vert, goal_vert))
#maze.init_plots(reinit=True)
#print(path)
fig, ax = plt.subplots()
plot_map(ax, img, goal, start)
graph.plot(ax)
path_plot = graph.plot_path(ax, path, color='r') # Draws the traced shortest path
plt.savefig('rrt-maze.pdf')